Dow Jones US30 Technical Analysis, The Dow Jones Index is trading today at $38715. Based on current technical analysis, the current trend indicates an upward trend in the US index prices. The price of the American index appears above most of the intersections of the moving averages, the MACD indicator provides positive signals, and the presence of buying strength is noted.
Based on this analysis, we expect the uptrend in the Dow Jones to continue, so we will buy after the price rises to $38715, and our target profit target will be at $38847. To ensure effective risk control, it is recommended to set the stop loss point at $38566.
Dow Jones US30 Technical Analysis: On the other hand
Dow Jones US30 Technical Analysis, If the stop loss area at $38566 is broken. The Dow Jones could head towards additional support at $38420.
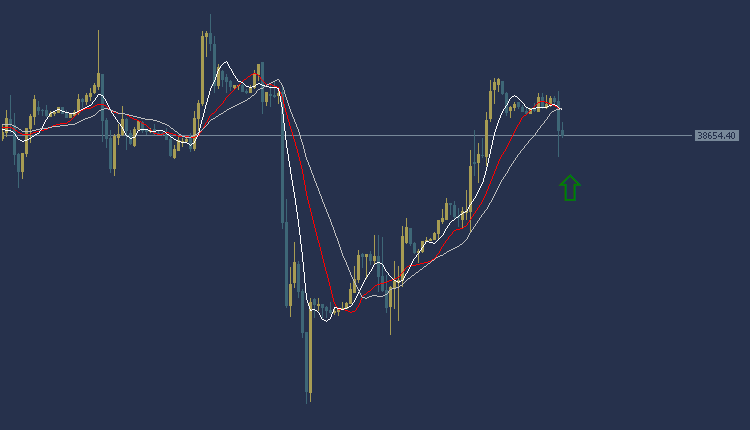
Dow Jones US30 Technical Analysis: resistance and support levels:
- Second resistance: 38814.53
- Initial resistance: 38793.82
- Pivot level: 38759.62
- First support: 38738.91
- Second support: 38704.71
USOIL Technical Analysis: Analysis of today’s oil price USOIL
USOIL Technical Analysis, we find the price of oil trading at $78.50 per barrel. Based on current technical analysis, the current trend shows the beginning of an upward trend in oil prices. The strength of this trend indicates a clear rise in the price of oil, as most of the moving average intersections have been successfully crossed. But in addition, the MACD indicator provides buying strength signals.
Based on this analysis, we will wait for oil to rise to the target level of $79.16 per barrel, while choosing $80.44 as a profit-taking target. It is necessary to set a stop loss point at the $77.61 per barrel area to ensure that risks are controlled effectively.
USOIL Technical Analysis: On the other hand
USOIL Technical Analysis, If the stop loss area at $77.61 per barrel is broken, the oil price could head towards the additional support level at $76.25 per barrel.
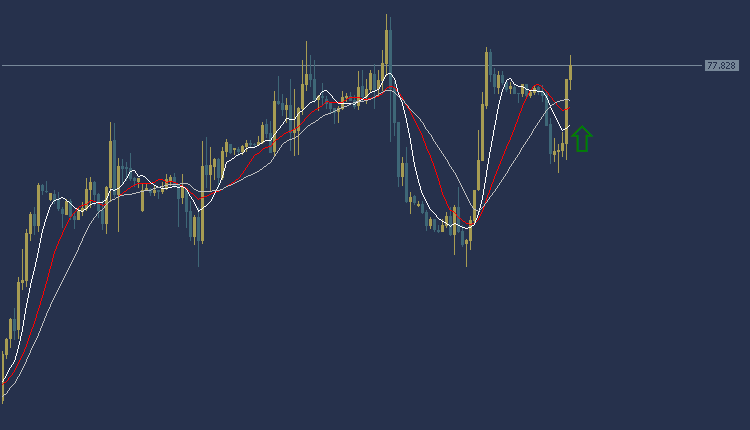
USOIL Technical Analysis: resistance and support analysis
- Second resistance: 77.76
- First resistance: 77.64
- Pivot level: 77.50
- First support: 77.38
- Second support: 77.24
EURUSD Technical Analysis: The EUR/USD is trading in an upward trend
EURUSD Technical Analysis, the EUR/USD is trading in an upward trend during the American session. The euro is trading at $1.0770, and as the chart shows, it is trading above most of the moving average intersections. The MACD indicator also indicates the emergence of a positive trend indicating the presence of buying power.
Accordingly, we can make a purchase while waiting for the EUR/USD price to rise at the level of $1.0785, and the target could be the $1.0800 area. It is also recommended to choose the $1.0758 area as a stop loss point to control risk.
EURUSD Technical Analysis: On the other hand
EURUSD Technical Analysis ,On the other hand, if the stop loss area at $1.0758 is broken, the euro price may head towards the $1.0740 level.
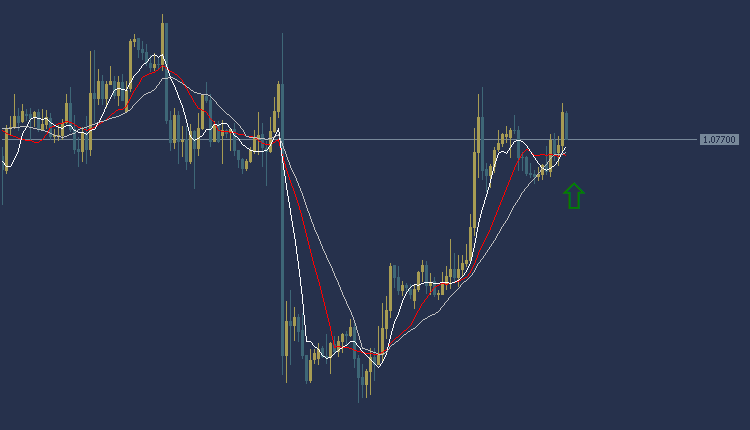
EURUSD Technical Analysis: resistance and support levels
- Second resistance: 1.0789
- First resistance: 1.0783
- Pivot level: 1.0775
- First support: 1.0769
- Second support: 1.0761
USDCAD Technical Analysis: The Canadian dollar is trading in a downward trend
USDCAD Technical Analysis, The US dollar is trading against the Canadian dollar today in a bearish trend during the American session. The Canadian dollar is trading at 1.3479, and trading appears below most of the moving average intersections. The MACD indicator also indicates a negative trend indicating a weakness in selling power.
Accordingly, we can consider selling while waiting for the price of the Canadian dollar pair to fall at the level of 1.3459, and the target could be the 1.3426 area. It is also recommended to choose the 1.3494 area as a stop loss point to control risk.
USDCAD Technical Analysis: On the other hand
USDCAD Technical Analysis, On the other hand, if the stop loss area at 1.3494 is broken, the Canadian dollar price may head towards the 1.3526 level.
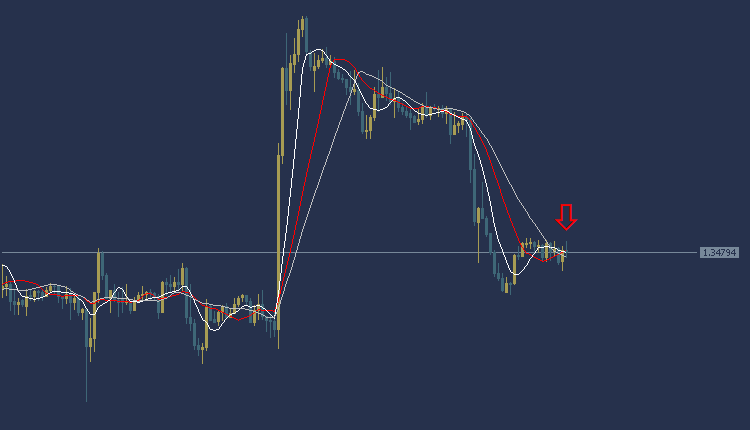
USDCAD Technical Analysis: resistance and support levels
- Second resistance: 1.3486
- First resistance: 1.3481
- Pivot level: 1.3478
- First support: 1.3473
- Second support: 1.3470