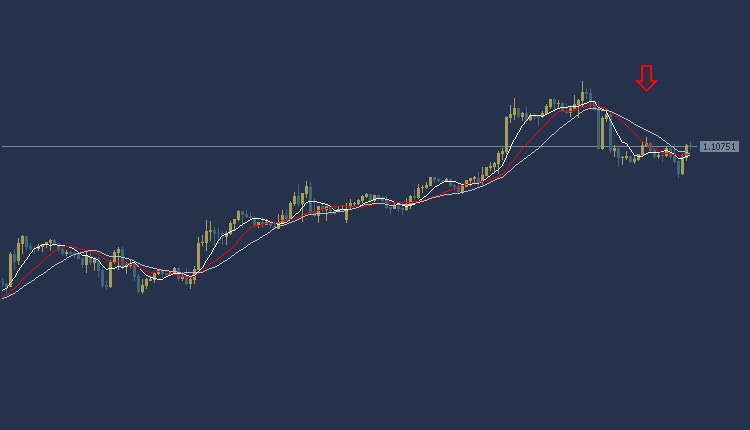
EURUSD Technical Analysis is in a weak downward trend today during the American session. The EURUSD is trading at $1.1079, where prices appear to trade below most of the moving average intersections shown on the chart. The MACD indicator also indicates the emergence of a weak negative trend with a decline in the euro against the US dollar. Accordingly, we can look to sell from a decline to the price of $1.1059, and the target could be the $1.1036 area. It is also recommended to choose the $1.1109 area as a stop loss point to control risk.
EURUSD Technical Analysis: On the other hand
On the other hand, if the stop loss area at $1.1109 is broken, the euro price may head towards the $1.1124 level.
Resistance and support levels
• Second resistance: 1.1099
• First resistance: 1.1088
• Pivot level: 1.1072
• First support: 1.1056
• Second support: 1.1051
USDJPY Technical Analysis: it is trading in a weak decline
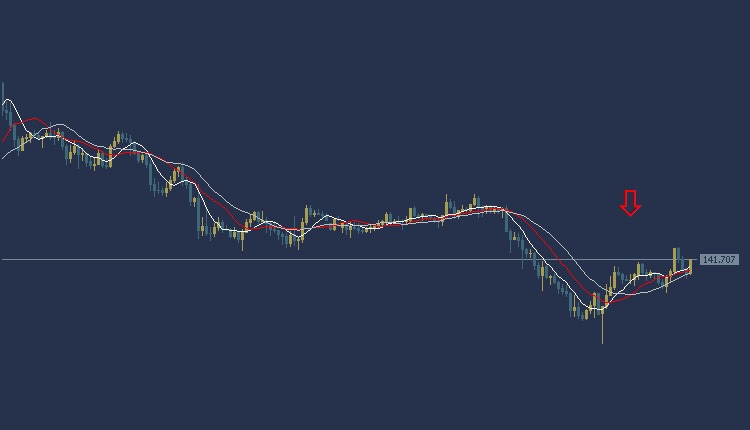
USDJPY Technical Analysis today in a bearish trend during the American session. The price of the dollar/yen is trading at 141.62, and trading appears below most of the moving average intersections. The MACD indicator also indicates the emergence of a negative trend amid weakness in selling power
Accordingly, we can look to sell from the decline to the price of 141.26, with the targeted target being the 140.81 area. It is also recommended to choose the 142.47 area as a stop-loss point to control risks.
USDJPY Technical Analysis: on the other hand
On the other hand, if the stop loss area at 142.47 is broken, the USD/JPY price may head towards the 142.85 level.
Resistance and support levels:
• Second resistance: 141.95
• First resistance: 141.86
• Pivot level: 141.62
• First support: 141.38
• Second support: 141.23
NAS100 NDX Technical Analysis: The American index is trading in an upward trend
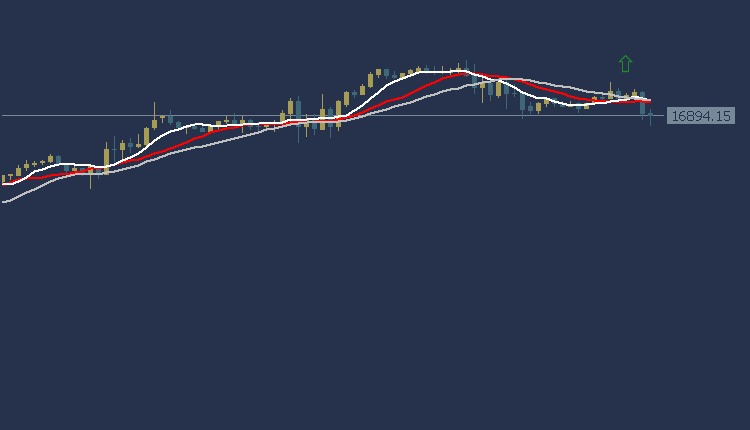
NAS100 NDX Technical Analysis: Today, the Nasdaq Index is trading at the $16,905.31 area. According to technical analysis, the current trend indicates a trend in the US index prices. The price of the indicator reflects the presence of upward strength, in an attempt to overcome most of the crossings of the moving average, and the MACD indicator also shows positive signs, with the appearance of weakness in buying power.
Accordingly, we expect the upward strength to continue, so we must wait for the index price to rise towards the $16,960.14 level to enter the purchase process. We will also target the $17,021.34 level as a profit-taking target. To ensure risk control, it is recommended to set a stop loss point at the $16,858.94 area.
NAS100 NDX Technical Analysis: on the other hand
If the stop loss area at $16,858.94 is broken, targeting the additional support level at $16,801.70 could be achieved.
Resistance and support analysis:
Second resistance: 17000.50
Initial resistance: 16980.50
Pivot level: 16960.14
First support: 16840.50
Second support: 16820.50
Gold Technical Analysis: Gold prices decline
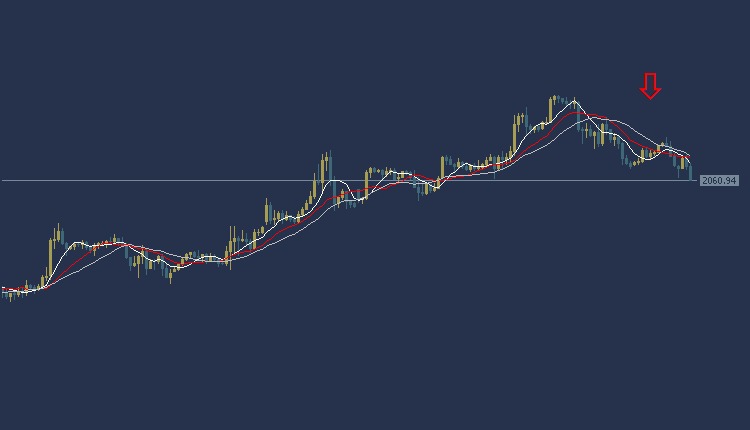
Gold Technical Analysis: The price of gold is trading today at $2060 per ounce. Trading appears in a downward trend, as the price of gold is trading below the intersections of the Moving Average indicators. As for the MACD indicator, it indicates the emergence of a negative trend.
Accordingly, we can look to sell from the decline to the price of $2055 per ounce, and target the $2049 per ounce area to take profits, while setting the $2072 per ounce area as a stop loss.
Gold Technical Analysis: On the other hand
On the other hand, if the stop loss area of $2072 per ounce is broken, the price may head to the $2077 per ounce area.
Resistance and support levels:
• Second resistance: 2079.82
• First resistance: 2077.29
• Pivot level: 2075.52
• First support: 2055.78
• Second support: 2048.90