
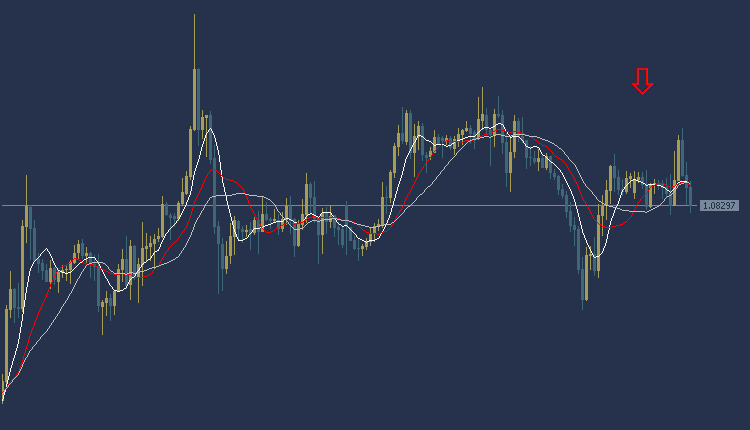
EURUSD Technical Analysis: The EURUSD is in a downward trend today during the American session. EURUSD is trading at $1.0829, where prices appear to trade below most of the moving average intersections shown on the chart. The MACD indicator also indicates a weak negative trend amid anticipation of the release of US economic data, including the unemployment claims index. Accordingly, we can look to sell from a decline to the price of $1.0819, and the target could be the $1.0805 area. It is also recommended to choose the $1.0846 area as a stop loss point to control risk.
EURUSD Technical Analysis: On the other hand
On the other hand, if the $1.0846 buy zone is broken, the target is $1.0856.
EURUSD Technical Analysis: resistance and support levels
• Second resistance: 1.0848
• First resistance: 1.0839
• Pivot level: 1.0832
• First support: 1.0822
• Second support: 1.0813
Gold Technical Analysis: sideways trading
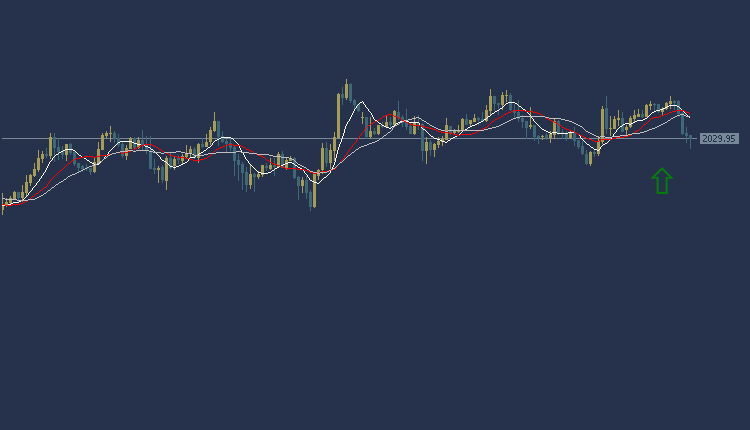
Gold Technical Analysis The price of gold today is trading at $2029 per ounce. Trading appears in a weak upward trend within the sideways trend, as the price of gold is trading above the intersections of the Moving Average indicators. As for the MACD indicator, it indicates weak positive signals with anticipation of the release of economic data. American, including the US unemployment claims index
Accordingly, we can look to buy from the rise to the price of $2032 per ounce, and target the $2037 per ounce area to take profits, while setting the $2022 per ounce area as a stop loss.
Gold Technical Analysis: On the other hand
On the other hand, if the $2022 per ounce selling area is broken, the price may head to the $2017 per ounce area.
Gold Technical Analysis: resistance and support levels
• Second resistance: 2032.17
• First resistance: 2031.50
• Pivot level: 2030.29
• First support: 2029.10
• Second support: 2028.62
NZDUSD Technical Analysis: bearish trading
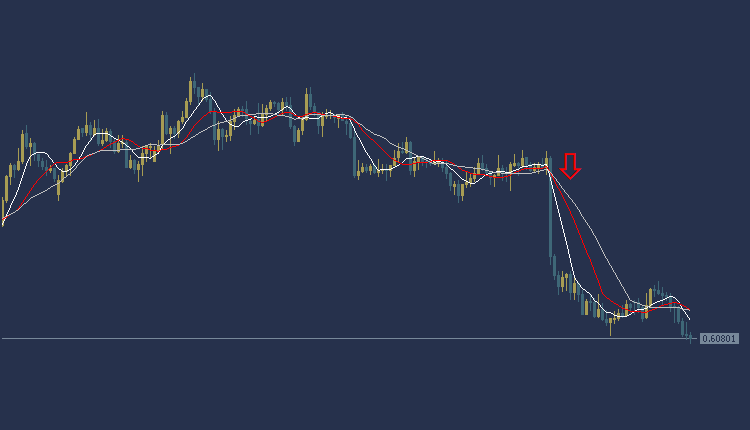
NZDUSD Technical Analysis: The NZDUSD is trading today in a bearish direction during the American session, as the price of the NZDUSD is trading at 0.6080, and trading appears below most of the moving average intersections. The MACD indicator also indicates negative signs while awaiting the release of US economic data, including the US unemployment claims index.
Accordingly, we can look to sell from the drop to the price of 0.6059, and the targeted target could be the 0.6030 area. It is also recommended to choose the 0.6124 area as a stop loss point to control risk.
NZDUSD Technical Analysis: On the other hand
On the other hand, if the buy zone at 0.6124 is broken, the New Zealand price may head towards the 0.6147 level.
NZDUSD Technical Analysis Resistance and Support:
• Second resistance: 0.6109
• First resistance: 0.6094
• Pivot level: 0.6085
• First support: 0.6072
• Second support: 0.6061
NAS100 NDX Technical Analysis: Trading in a downward trend
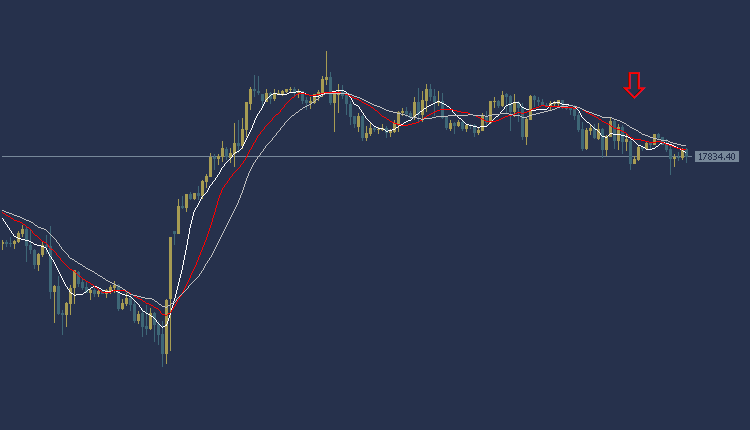
NAS100 NDX Technical Analysis is trading at the $17834 area. According to technical analysis, the current trend is a downward trend in the American index prices. The price of the American index appears below most of the crossings of the moving averages, and the MACD indicator also shows negative signs
Accordingly, we expect the index to take a downward trend, so we will sell from the drop to the 17777 level, and we will also target the $17700 level as a profit-taking target. To ensure risk control, it is recommended to set a stop loss point at the $17952 area.
NAS100 NDX Technical Analysis: on the other hand
In case the buy zone at $17952 is broken, targeting additional support level at $18011 could be achieved.
NAS100 NDX Technical Analysis resistance and support
Second resistance: 18039.17
Initial resistance: 17895.26
Pivot level: 17876.41
First support: 17793.83
Second support: 17749.79


