
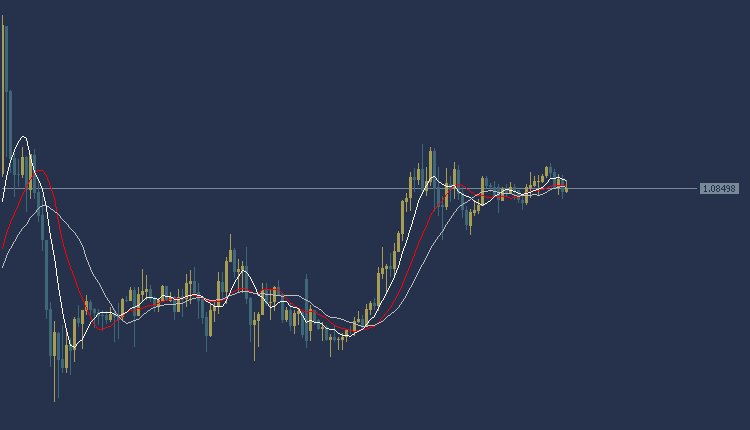
EURUSD Technical Analysis Today, the EURUSD is trading in a sideways trend during the European session. The euro is trading at $1.0849, and as shown in the trading chart, weakness appears in most of the moving average intersections. The MACD indicator also indicates a positive trend indicating a weakness in buying power.
Accordingly, we can make a purchase if the Euro/Dollar price breaks at the level of $1.0849, and the target could be the $1.0875 area. It is also recommended to choose the $1.0815 area as a stop loss point to control risk.
EURUSD Technical Analysis: On the other hand
On the other hand, if the support area at $1.0815 is broken, the euro price may head towards the $1.0785 level.
EURUSD Technical Analysis: resistance and support levels
• Second resistance: 1.0857
• First resistance: 1.0854
• Pivot level: 1.0851
• First support: 1.0848
• Second support: 1.0845
GBPUSD Technical Analysis: It trades in a sideways direction
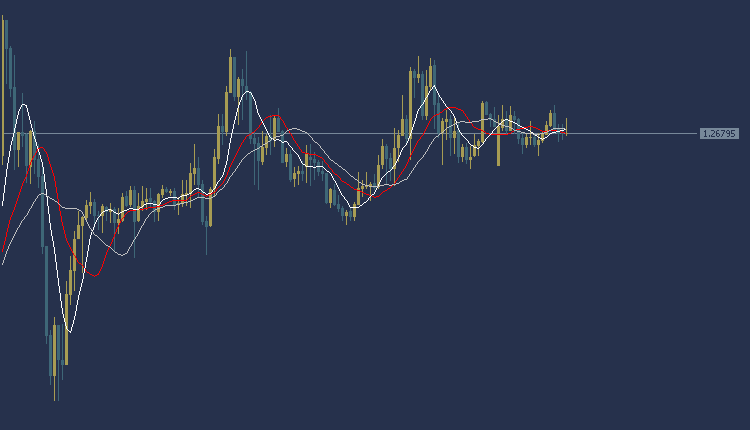
GBPUSD Technical Analysis, the pound dollar is trading in a sideways direction today during the European session. The pound is trading at $1.2679, and as the chart shows, there is weakness in most of the moving average intersections. The MACD indicator also indicates a positive trend indicating a weakness in buying power.
Accordingly, we can make a purchase if the price of the pound/dollar pair breaks the $1.2690 area, and the target could be the $1.2720 area. It is also recommended to choose the $1.2658 area as a stop loss point to control risk.
GBPUSD Technical Analysis: On the other hand
On the other hand, if the support area at $1.2658 is broken, the pound price may head towards the $1.2620 level.
GBPUSD Technical Analysis: resistance and support levels
• Second resistance: 1.2691
• First resistance: 1.2686
• Pivot level: 1.2682
• First support: 1.2677
• Second support: 1.2673
Gold Technical Analysis: gold price today
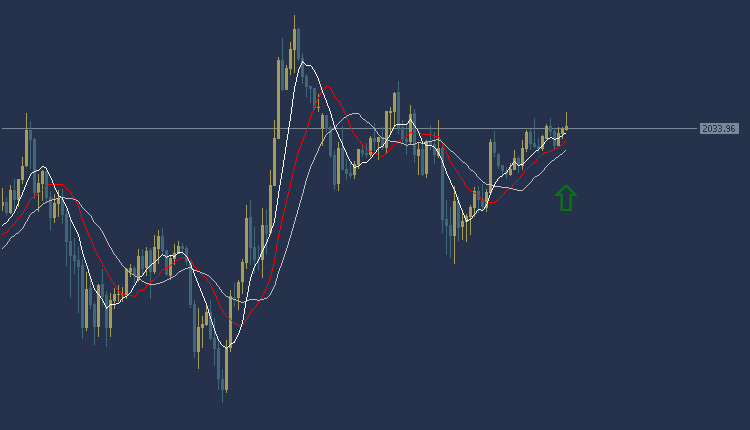
Gold Technical Analysis, the price of gold today against the dollar during the European session is in a general upward trend. Gold is trading at $2033 per ounce, and trading appears above most of the moving average intersections, as shown in the chart. The MACD indicator also indicates a positive trend indicating the presence of buying power.
Accordingly, we can buy while waiting for the price of the yellow metal, gold, to rise to the area of $2036 per ounce, and the target could be the $2040 area per ounce. It is also recommended to choose the $2030 per ounce area as a stop loss point to control risk.
Gold Technical Analysis: On the other hand
On the other hand, if the support area at $2030 per ounce is broken, the gold price may head towards the $2027 per ounce level.
Gold Technical Analysis: resistance and support levels
• Second resistance: 2043.90
• First resistance: 2043.40
• Pivot level: 2042.75
• First support: 2042.25
• Second support: 2041.60


