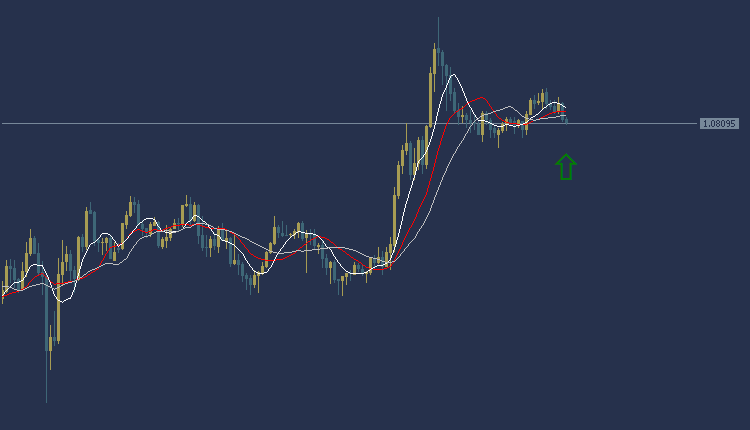
EURUSD Technical Analysis, the EURUSD is trading in a sideways trend during the European session. The euro is trading at $1.0809, and as shown in the trading chart, weakness appears in most of the moving average intersections. The MACD indicator also indicates a negative trend indicating a weakness in selling power.
Accordingly, we can make a purchase if the Euro/Dollar price breaks at the level of $1.0824, and the target could be the $1.0852 area. It is also recommended to choose the $1.0793 area as a stop loss point to control risk.
EURUSD Technical Analysis: On the other hand
EURUSD Technical Analysis, On the other hand, if the stop loss area at $1.0793 is broken, the euro price may head towards the $1.0763 level.
EURUSD Technical Analysis: resistance and support levels
• Second resistance: 1.0820
• First resistance: 1.0818
• Pivot level: 1.0815
• First support: 1.0813
• Second support: 1.0810
GBPUSD Technical Analysis: It is trading in an upward trend
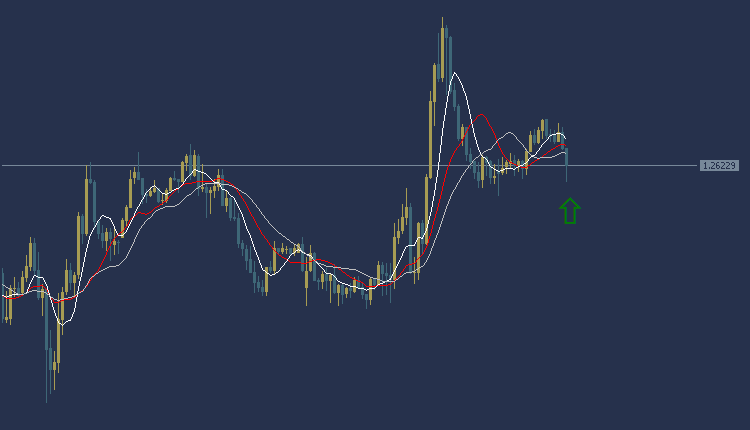
GBPUSD Technical Analysis, The pound dollar is trading in an upward trend today during the European session. The pound is trading at $1.2623, and as the chart shows, the pound is trading above most of the moving average intersections. The MACD indicator also indicates a positive trend indicating a weakness in buying power.
Accordingly, we can make a purchase if the price of the pound/dollar pair breaks the $1.2635 area, and the target could be the $1.2661 area. It is also recommended to choose the $1.2611 area as a stop loss point to control risk.
GBPUSD analysis: On the other hand
GBPUSD Technical Analysis ,On the other hand, if the stop loss area at $1.2611 is broken, the pound price may head towards the $1.2587 level.
GBPUSD Technical Analysis: resistance and support levels
• Second resistance: 1.2639
• First resistance: 1.2636
• Pivot level: 1.2633
• First support: 1.2630
• Second support: 1.2627
Gold Technical Analysis: gold price today
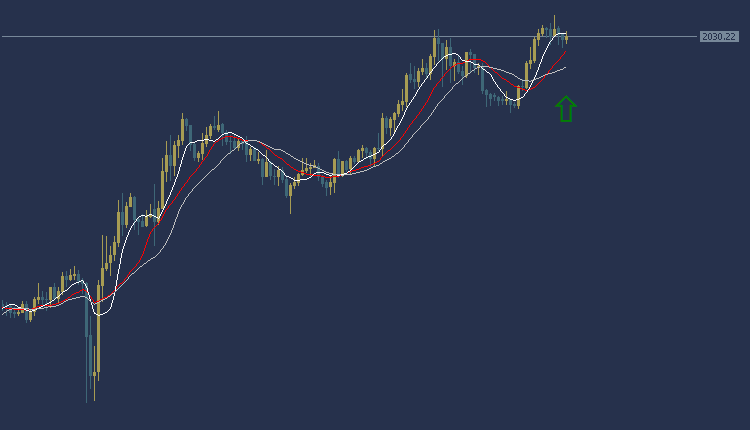
Gold Technical Analysis, the price of gold today against the dollar during the European session is in a general upward trend. Gold is trading at $2030 per ounce, and trading appears above most of the moving average intersections, as shown in the chart. The MACD indicator also indicates a positive trend indicating the presence of buying power.
Accordingly, we can buy while waiting for the price of the yellow metal, gold, to rise to the area of $2034 per ounce, and the target could be the $2040 area per ounce. It is also recommended to choose the $2026 per ounce area as a stop loss point to control risk.
Gold Technical Analysis: On the other hand
On the other hand, if the stop loss area at $2026 per ounce is broken, the gold price may head towards the $2020 per ounce level.
Gold Technical Analysis: resistance and support levels
• Second resistance: 2042.90
• First resistance: 2041.85
• Pivot level: 2040.95
• First support: 2039.90
• Second support: 2039.00