
EURUSD Technical Analysis: The EURUSD is in a weak downward trend today during the American session. The EURUSD is trading at $1.0838, where prices appear to trade below most of the moving average intersections shown on the chart. The MACD indicator also indicates a weak negative trend with a decline in selling orders amid today’s anticipation of the US interest rate decision. Accordingly, we can look to sell from a decline to the price of $1.0820, and the target could be the $1.0797 area. It is also recommended to choose the $1.0864 area as a stop loss point to control risk.
EURUSD Technical Analysis: On the other hand
On the other hand, if the stop loss area at $1.0864 is broken, the euro price may head towards the $1.0881 level.

EURUSD Technical Analysis: resistance and support levels
• Second resistance: 1.0857
• First resistance: 1.0849
• Pivot level: 1.0842
• First support: 1.0830
• Second support: 1.0821
NZDUSD Technical Analysis: bullish trading
NZDUSD Technical Analysis: The NZDUSD is trading in a weak upward trend today during the American session. The NZDUSD price is trading at 0.6127, and trading appears above most of the moving average intersections. The MACD indicator also indicates weak positive signals in buy orders, with anticipation of the US interest rate decision being issued today.
Based on this, we can look to buy from the rise to the price of 0.6136, and the targeted target could be the 0.6148 area. It is also recommended to choose the 0.6111 area as a stop loss point to control risk.
NZDUSD Technical Analysis: On the other hand
On the other hand, if the stop loss area at 0.6111 is broken, the NZD price may head towards the 0.6102 level.

NZDUSD Technical Analysis Resistance and Support:
• Second resistance: 0.6159
• First resistance: 0.6149
• Pivot level: 0.6134
• First support: 0.6120
• Second support: 0.6113
Gold Technical Analysis: Gold prices rise
Gold Technical Analysis: The price of gold is trading today at $2037 per ounce. Trading appears in an upward trend, as the price of gold is trading above the intersections of the Moving Average indicators. As for the MACD indicator, it indicates positive signals.
Accordingly, we can look to buy from the rise to the price of $2041 per ounce, and target the $2045 per ounce area to take profits, while setting the $2031 per ounce area as a stop loss.
Gold Technical Analysis: On the other hand
On the other hand, if the stop loss area of $2031 per ounce is broken, the price may head to the $2027 per ounce area.

Gold Technical Analysis: resistance and support levels
• Second resistance: 2039.00
• First resistance: 2038.66
• Pivot level: 2038.25
• First support: 2036.88
• Second support: 2034.80
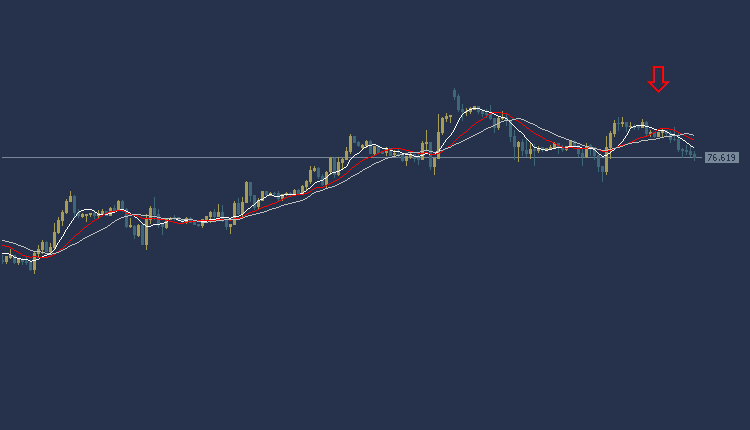
USOIL Technical Analysis: Oil prices decline
USOIL Technical Analysis, in the global oil market, the price is trading at the area of $76.56 per barrel. According to technical analysis, the current trend indicates the beginning of a downward trend with prices trading below the intersections of the moving average, and the MACD indicator also shows the beginning of the appearance of a negative trend signal.
Accordingly, it is possible to sell from a decline to the price of 76.04, and we will target $75.34 per barrel as a profit-taking target. To ensure risk control, it is recommended to set a stop loss point at the $77.22 per barrel area.
USOIL Technical Analysis: On the other side
If the stop loss area at 77.22 per barrel is broken, targeting the additional support level at $77.81 per barrel could be achieved.
USOIL Technical Analysis: resistance and support levels
• Second resistance: 76.75
• First resistance: 76.68
• Pivot level: 76.60
• First support: 76.00
• Second support: 75.75


