
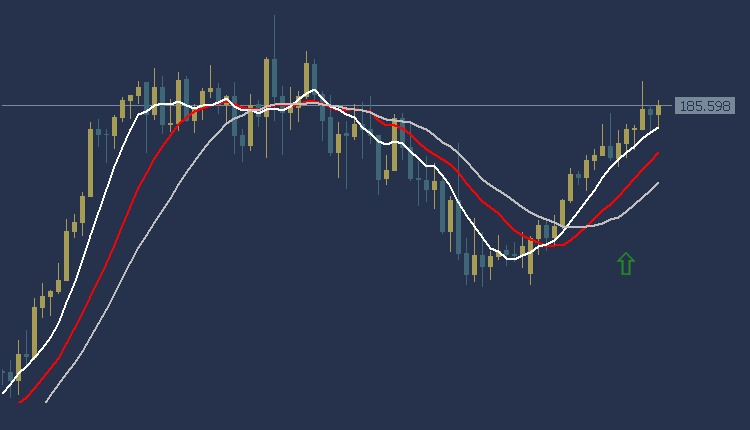
GBPJPY Analysis trading at the end of the US session at a price of 185.47, and trading shows strength in most of the moving average intersections. The MACD indicator also indicates a positive trend indicating the presence of buying strength.
Accordingly, we can consider buying while waiting for the price to rise at the 186.12 area, and the target could be the 187.05 area. It is also recommended to choose the 184.44 area as a stop loss point to control risks.
GBPJPY Analysis: on the other hand
If the stop loss area at 184.44 is broken, the pound price may head towards the 183.48 level
GBPJPY Analysis: resistance and support levels:
• Second resistance: 186.60
• First resistance: 186.40
• Pivot level: 185.54
• First support: 184.00
• Second support: 183.70
EURUSD Technical Analysis a sideways trend
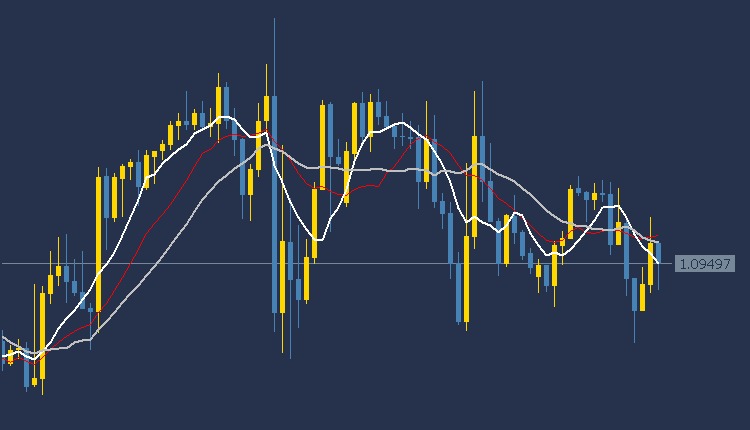
EURUSD Technical Analysis: Today, the EUR/USD is trading in a consolidation trend during the American session. The euro/dollar is trading at $1.0946, and trading shows weakness at most of the moving average intersections. The MACD indicator also indicates the emergence of a weak negative trend
Accordingly, if the resistance area is breached, we will buy from the price of $1.0981, and the targeted target could be the $1.1019 area. If the support at $1.0927 is broken, we sell from this support and target the next support area at $1.0901.
EURUSD Technical Analysis: resistance and support levels:
• Second resistance: 1.1000
• First resistance: 1.0990
• Pivot level: 1.0952
• First support: 1.0920
• Second support: 1.0910
Gold Technical Analysis: XAUUSD is trading in an upward trend
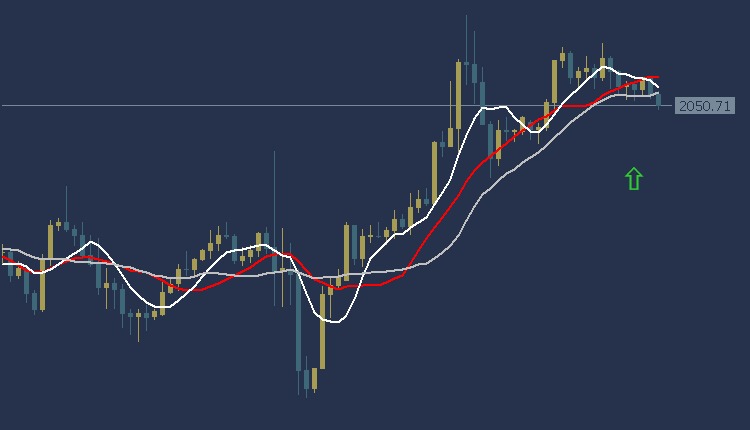
Gold Technical Analysis today, in the current American trading session, shows an upward trend. Gold is currently trading at $2051.38 per ounce. Trading above most moving average crossovers, as can be clearly seen in the chart. For reference, the MACD indicator shows a positive trend, which indicates the emergence of buying power.
Based on this analysis, we can consider a buying opportunity while waiting for the gold price to rise to the target area of $2062.46 per ounce, and the next target may reach the area of $2074.28 per ounce. It is also preferable to set the $2041.47 per ounce area as a stop loss point, in order to contribute to effective risk management.
Gold Technical Analysis today on the other hand
On the other hand, if the stop loss area at $2041.47 per ounce is broken, this could lead to the gold price falling towards the $2029.44 per ounce level.
Gold Technical Analysis: resistance and support levels:
Second resistance: 2070.50
First resistance: 2068.50
Pivot level: 2051.38
First support: 2035.00
Second support: 2030.50
Dow Jones US30 Technical Analysis: It is trading in an upward trend
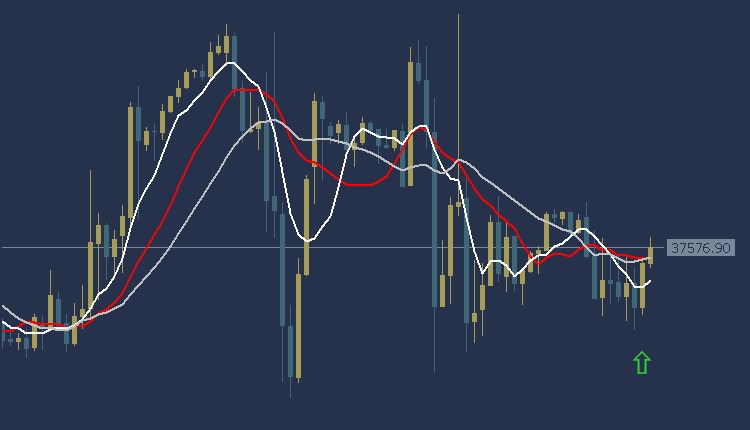
Dow Jones US30 Technical Analysis, the Dow Jones Index is trading at the $37,567 area. According to technical analysis, the current trend is an upward trend in the American index prices. The price of the American index appears above most of the moving average intersections, and the MACD indicator also shows positive signs
Accordingly, we expect the index to take an upward trend, so we will buy from the level of 37749, and we will also target the level of $37999 as a profit-taking target. To ensure risk control, it is recommended to set a stop loss point at the $37,315 area.
Dow Jones US30 Technical Analysis: on the other hand
If the stop loss area at $37,315 is broken, targeting the additional support level at $37,081 could be achieved.
Dow Jones US30 Technical Analysis: resistance and support levels:
Second resistance: 37900.58
Initial resistance: 37800.82
Pivot level: 37567.90
First support: 37200.02
Second support: 37100.38


