
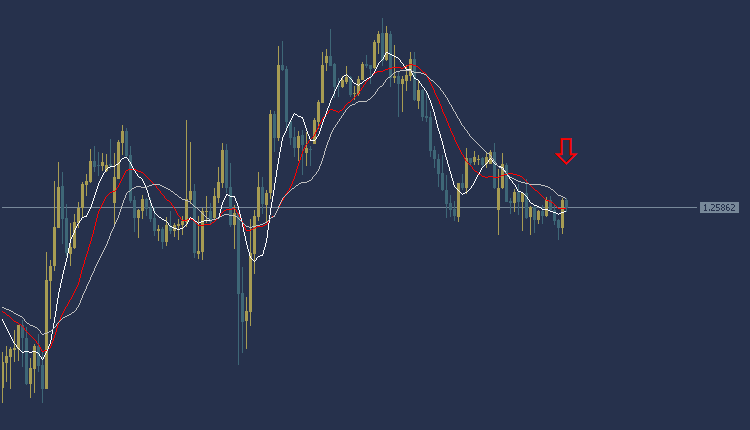
GBPUSD Technical Analysis, the pound dollar is trading in a bearish trend today during the European session. The pound is trading at $1.2584, and as the chart shows, the pound is trading below most of the moving average intersections. The MACD indicator also indicates a negative trend indicating the presence of selling power.
Accordingly, we can carry out a selling operation if the price of the pound/dollar pair breaks the $1.2572 area, and the target could be the $1.2549 area. It is also recommended to choose the $1.2598 area as a stop loss point to control risk.
GBPUSD Technical Analysis: On the other hand
On the other hand, if the stop loss area at $1.2598 is broken, the pound price may head towards the $1.2620 level.
GBPUSD Technical Analysis: resistance and support levels
• Second resistance: 1.2592
• First resistance: 1.2587
• Pivot level: 1.2583
• First support: 1.2578
• Second support: 1.2574
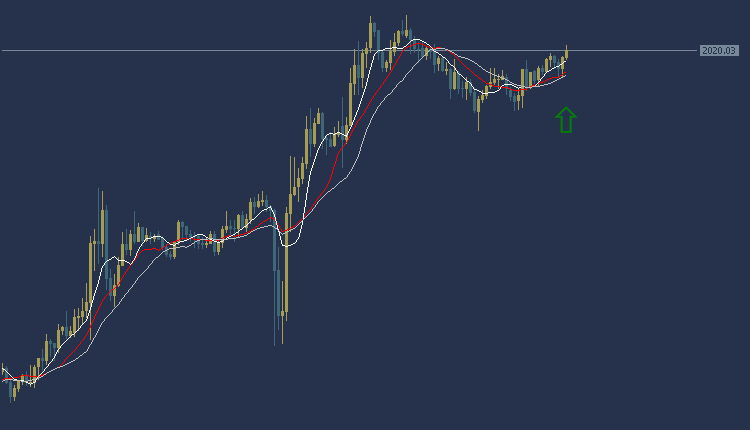
Gold Technical Analysis: today’s gold price
Gold Technical Analysis, the price of gold today against the dollar during the European session is in a general upward trend. Gold is trading at $2019 per ounce, and trading appears above most of the moving average intersections, as shown in the chart. The MACD indicator also indicates a positive trend indicating the presence of buying power.
Accordingly, we can buy while waiting for the price of the yellow metal, gold, to rise to the region of $2022 per ounce, and the target could be the $2028 region per ounce. It is also advisable to choose the 2016 dollar per ounce area as a stop loss point to control risk.
Gold Technical Analysis: On the other hand
On the other hand, if the stop loss area at $2016 per ounce is broken, the gold price may head towards the $2010 per ounce level.
Gold Technical Analysis: resistance and support levels
• Second resistance: 2033.72
• First resistance: 2032.59
• Pivot level: 2031.52
• First support: 2030.39
• Second support: 2029.32
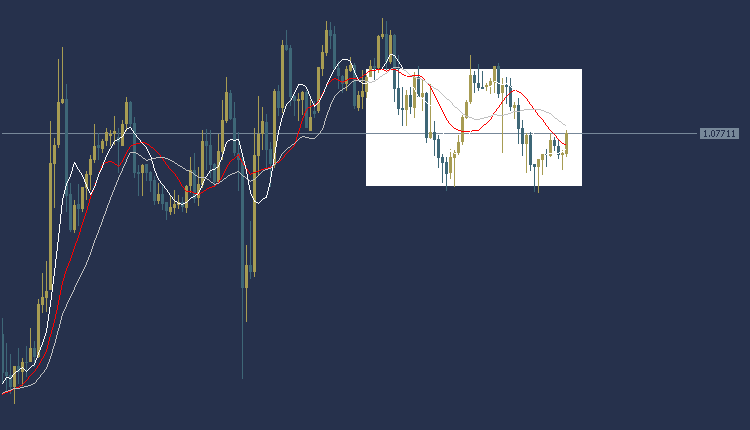
EURUSD Technical Analysis: It trades in a sideways direction
EURUSD Technical Analysis, the EUR/USD is trading in a sideways trend during the European session. The euro is trading at $1.0770, and as shown in the trading chart, weakness appears in most of the moving average intersections. The MACD indicator also indicates a negative trend indicating a weakness in selling power.
Accordingly, we can make a purchase if the Euro/Dollar price breaks at the level of $1.0783, and the target could be the $1.0800 area. It is also recommended to choose the $1.0671 area as a stop loss point to control risk.
EURUSD Technical Analysis: On the other hand
EURUSD Technical Analysis, On the other hand, if the stop loss area at $1.0671 is broken, the euro price may head towards the $1.0744 level.
EURUSD Technical Analysis: resistance and support levels
• Second resistance: 1.0791
• First resistance: 1.0784
• Pivot level: 1.0780
• First support: 1.0773
• Second support: 1.0769


