
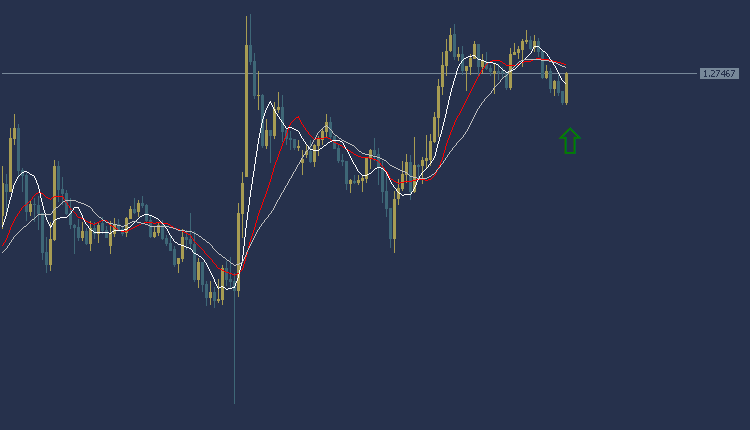
The pound dollar is trading in an upward trend today during the European session. The pound is trading at $1.2744, and as the chart shows, the pound is trading weakly at the intersections of the moving averages. The MACD indicator also indicates a positive trend indicating a weakness in buying power.
Accordingly, we can make a purchase while waiting for the price of the pound-dollar pair to rise to the $1.2759 area, and the target could be the $1.2785 area. It is also recommended to choose the $1.2729 area as a stop loss point to control risks.
GBPUSD Technical Analysis: On the other hand
On the other hand, if the stop loss area at $1.2729 is broken, the pound price may head towards the $1.2699 level.
GBPUSD Technical Analysis: resistance and support levels
Second resistance: 1.2751
First resistance: 1.2743
Pivot level: 1.2738
First support: 1.2730
Second support: 1.2725
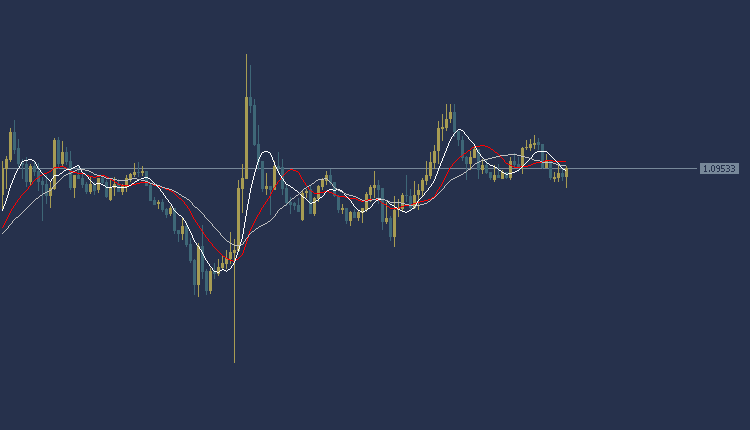
EURUSD Technical Analysis: It trades in a sideways direction
the EUR/USD Today, is trading in a sideways trend during the European session. We advise against trading in the EUR/USD until clear signals confirm the trend
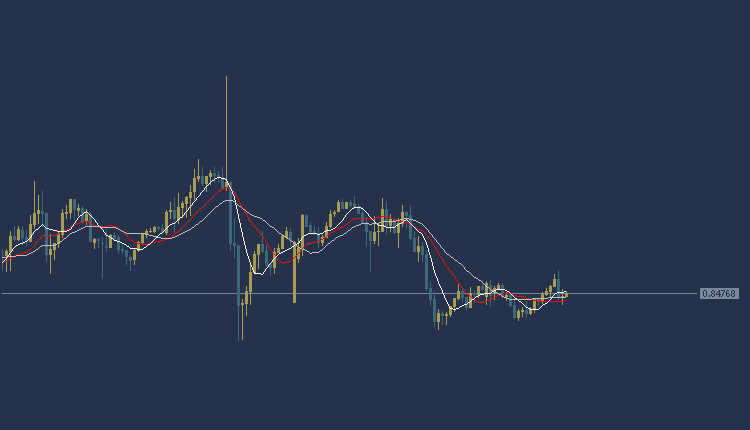
USDCHF Technical Analysis: It trades in a sideways direction
USDCHF The dollar and franc are trading in a sideways trend today during the European session. We advise against trading the dollar and the franc until clear signals confirm the trend
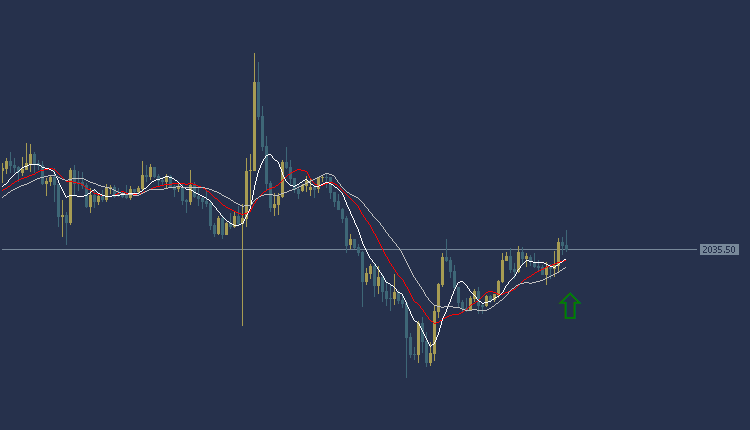
Gold Technical Analysis: today’s gold price
Gold price Today against the dollar during the European session is taking an upward trend. Gold is trading at $2035 per ounce, and trading appears above most of the moving average intersections, as shown in the chart. The MACD indicator also indicates a positive trend indicating the presence of buying power.
Accordingly, we can buy while waiting for the price of the yellow metal, gold, to rise to the area of $2039 per ounce, and the target could be the $2045 area per ounce. It is also recommended to choose the $2031 per ounce area as a stop loss point to control risk.
Gold Technical Analysis: On the other hand
Gold Technical Analysis on the other hand, if the stop loss area at $2031 per ounce is broken, the gold price may head towards the $2025 per ounce level.
Gold Technical Analysis: resistance and support levels
• Second resistance: 2045.77
• First resistance: 2043.84
• Pivot level: 2040.92
• First support: 2038.99
• Second support: 2036.07


