
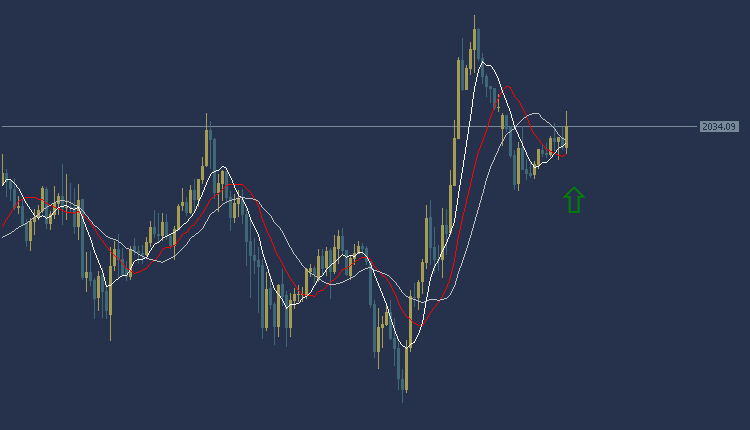
Gold Technical Analysis, the price of gold today against the dollar during the European session is in a general upward trend. Gold is trading at $2034 per ounce, and trading appears above most of the moving average intersections, as shown in the chart. The MACD indicator also indicates a positive trend indicating the presence of buying power.
Accordingly, we can buy while waiting for the price of the yellow metal, gold, to rise to the area of $2037 per ounce, and the target could be the $2040 area per ounce. It is also recommended to choose the $2030 per ounce area as a stop loss point to control risk.
Gold Technical Analysis: On the other hand
On the other hand, if the support area at $2030 per ounce is broken, the gold price may head towards the $2027 per ounce level.
Gold Technical Analysis: resistance and support levels
• Second resistance: 2044.28
• First resistance: 2043.21
• Pivot level: 2042.28
• First support: 2041.21
• Second support: 2040.28
EURUSD Technical Analysis: It trades in a sideways direction
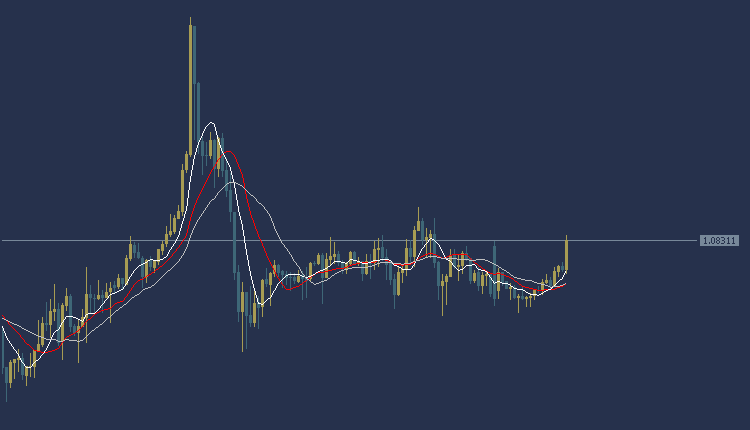
EURUSD Technical Analysis ,Today. the EUR/USD is trading in a sideways trend during the European session. The euro is trading at $1.0831, and as the chart shows, it is trading above most of the moving average intersections. The MACD indicator also indicates a negative trend indicating a weakness in selling power.
Accordingly, we can carry out a selling operation if the Euro/Dollar price breaks at the level of $1.0840, and the target could be the $1.0870 area. It is also recommended to choose the $1.0810 area as a stop loss point to control risk.
EURUSD Technical Analysis: On the other hand
On the other hand, if the support area at $1.0810 is broken, the euro price may head towards the $1.0780 level.
EURUSD Technical Analysis: resistance and support levels
• Second resistance: 1.0829
• First resistance: 1.0826
• Pivot level: 1.0822
• First support: 1.0819
• Second support: 1.0815
GBPUSD Technical Analysis: It is trading in an upward trend
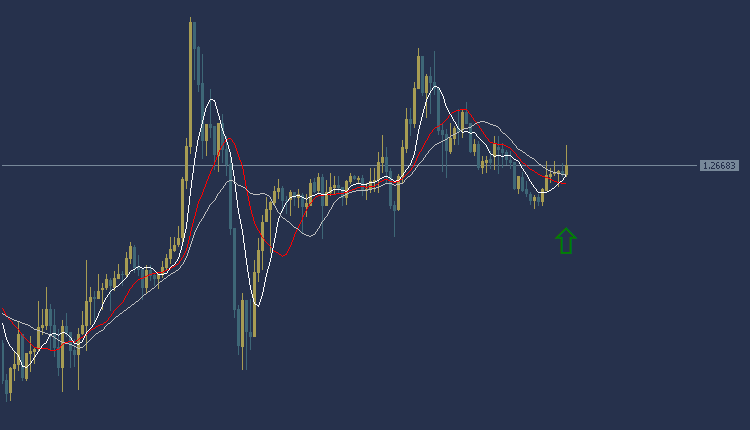
GBPUSD Technical Analysis, The pound dollar is trading in an upward trend today during the European session. The pound is trading at $1.2668, and as the chart shows, the pound is trading above most of the intersections of the moving averages. The MACD indicator also indicates a positive trend indicating a weakness in buying power.
Accordingly, we can make a purchase if the price of the pound/dollar pair breaks the $1.2680 area, and the target could be the $1.2710 area. It is also recommended to choose the $1.2648 area as a stop loss point to control risk.
GBPUSD Technical Analysis: On the other hand
On the other hand, if the support area at $1.2648 is broken, the pound price may head towards the $1.2610 level.
GBPUSD Technical Analysis: resistance and support levels
• Second resistance: 1.2674
• First resistance: 1.2670
• Pivot level: 1.2667
• First support: 1.2663
• Second support: 1.2660


