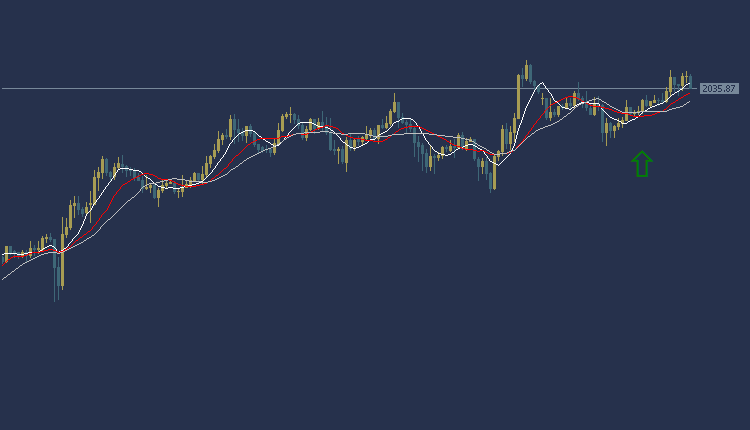
Gold Technical Analysis: The price of gold is trading today at $2035 per ounce. Trading appears in an upward trend, as the price of gold is trading above the intersections of the Moving Average indicators. As for the MACD indicator, it indicates positive signals.
Accordingly, we can look to buy from the rise to the price of $2040 per ounce, and target the $2046 per ounce area to take profits, while setting the $2026 per ounce area as a stop loss.
Gold Technical Analysis: On the other hand
On the other hand, if the $2026 per ounce selling area is broken, the price may head to the $2020 per ounce area.
Gold Technical Analysis: resistance and support levels
- Second resistance: 2036.86
- First resistance: 2036.46
- Pivot level: 2036.00
- First support: 2035.20
- Second support: 2034.83
NAS100 NDX Technical Analysis: Trading in a downward trend
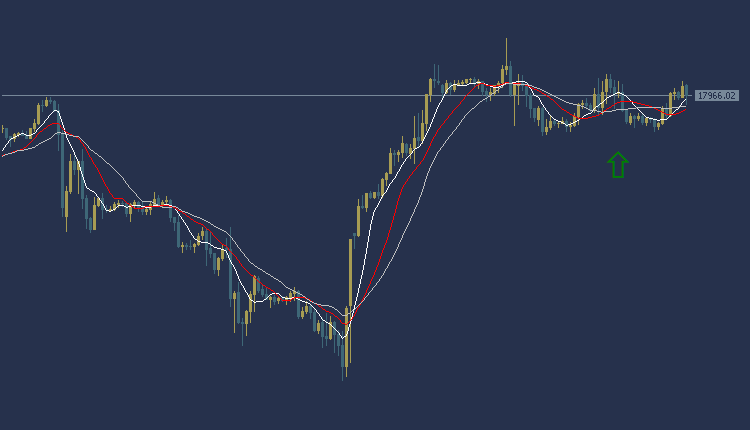
NAS100 NDX Technical Analysis is trading at $17966. According to technical analysis, the current trend is an upward trend in the American index prices. The price of the American index appears above most of the intersections of the moving averages, and the MACD indicator also shows positive signs
Accordingly, we expect the index to take an upward trend, so we will buy from the rise to the 18031 level, and we will also target the $18110 level as a profit-taking target. To ensure risk control, it is recommended to set a stop loss point at the $17816 area.
NAS100 NDX Technical Analysis: on the other hand
In case the selling area at $17816 is broken, targeting the additional support level at $17739 could be achieved.
NAS100 NDX Technical Analysis: resistance and support
- Second resistance: 18097.13
- Initial resistance: 18066.16
- Pivot level: 17988.50
- First support: 17923.75
- Second support: 17886.93
GBPUSD Technical Analysis: trade in an upward trend
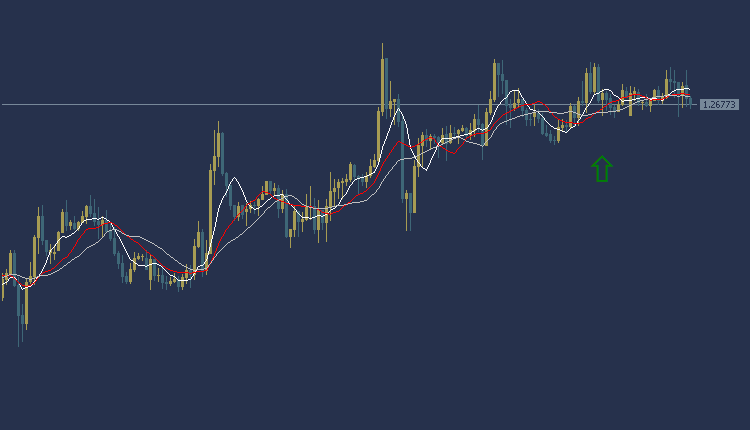
GBPUSD Technical Analysis today is in an upward trend during the American session. The GBPUSD is trading at $1.2677, and trading appears above most of the moving average intersections. The MACD indicator also indicates a weak positive trend. Accordingly, we can look to buy from the rise to the price of $1.2690, and the target could be the $1.2715 area. It is also recommended to choose the $1.2646 area as a stop loss point to control risk.
GBPUSD Technical Analysis: on the other side
On the other hand, if the sell area at $1.2646 is broken, the GBPUSD price may head towards the $1.2630 level.
GBPUSD Technical Analysis: resistance and support levels
- Second resistance: 1.2698
- First resistance: 1.2689
- Pivot level: 1.2681
- First support: 1.2670
- Second support: 1.2663
NZDUSD Technical Analysis: bearish trading
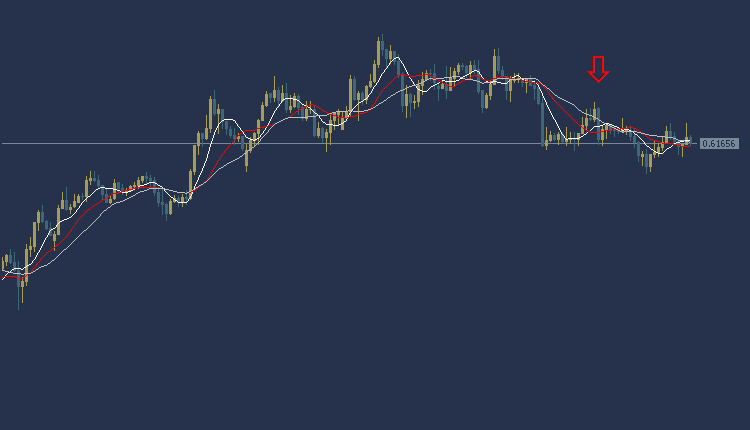
NZDUSD Technical Analysis: The NZDUSD is trading today in a bearish direction during the American session, as the price of NZDUSD is trading at 0.6165, and trading appears below most of the moving average intersections. The MACD indicator also indicates negative signals
Accordingly, we can look to sell from the drop to the price of 0.6152, and the targeted target could be the 0.6134 area. It is also recommended to choose the 0.6184 area as a stop loss point to control risk.
NZDUSD Technical Analysis: On the other hand
On the other hand, if the buy zone at 0.6184 is broken, the NZDUSD price may head towards the 0.6197 level.
NZDUSD Technical Analysis Resistance and Support:
- Second resistance: 0.6187
- First resistance: 0.6176
- Pivot level: 0.6169
- First support: 0.6158
- Second support: 0.6150