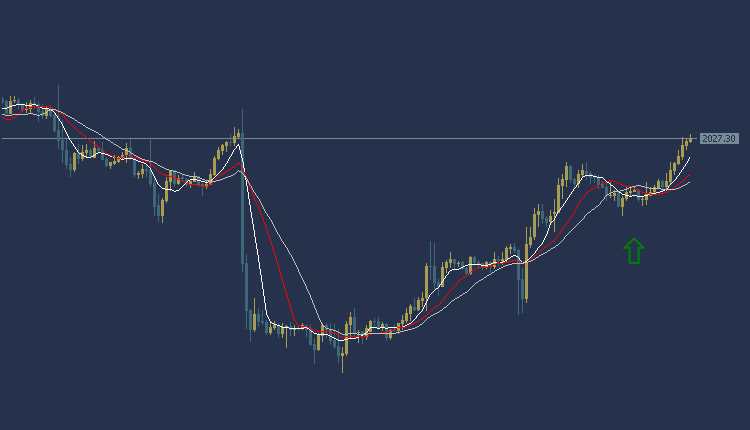
Gold Technical Analysis: The price of gold is trading today at $2027 per ounce. Trading appears in an upward trend, as the price of gold is trading above the intersections of the Moving Average indicators. As for the MACD indicator, it indicates positive signals.
Accordingly, we can look to buy from the rise to the price of $2031 per ounce, and target the $2037 per ounce area to take profits, while setting the $2018 per ounce area as a stop loss.
Gold Technical Analysis: On the other hand
On the other hand, if the stop loss area of $2018 per ounce is broken, the price may head to the $2013 per ounce area.
Gold Technical Analysis: resistance and support levels
• Second resistance: 2029.09
• First resistance: 2028.70
• Pivot level: 2027.39
• First support: 2026.50
• Second support: 2025.54
USOIL Technical Analysis: Oil prices decline
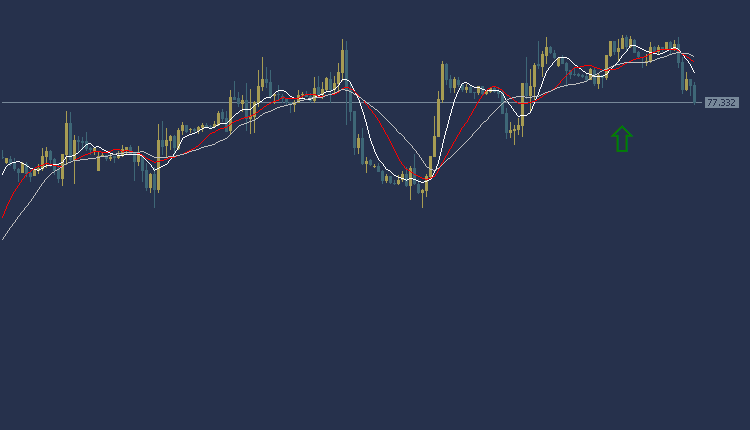
USOIL Technical Analysis, in the global oil market, the price is trading at $77.18 per barrel. According to technical analysis, the current trend indicates a weak upward trend with prices trading below the moving average intersections, and the MACD indicator also shows the emergence of a weak positive trend signal.
Accordingly, buying can rise to the price of 77.58, and we will target $78.11 per barrel as a profit-taking target. To ensure risk control, it is recommended to set a stop loss point at the $76.49 per barrel area.
USOIL Technical Analysis: On the other side
If the stop loss area at 76.49 per barrel is broken, targeting the additional support level at $76.01 per barrel could be achieved.
USOIL Technical Analysis: resistance and support levels
• Second resistance: 77.78
• First resistance: 77.49
• Pivot level: 77.25
• First support: 76.86
• Second support: 76.64
NZDUSD Technical Analysis: bullish trading
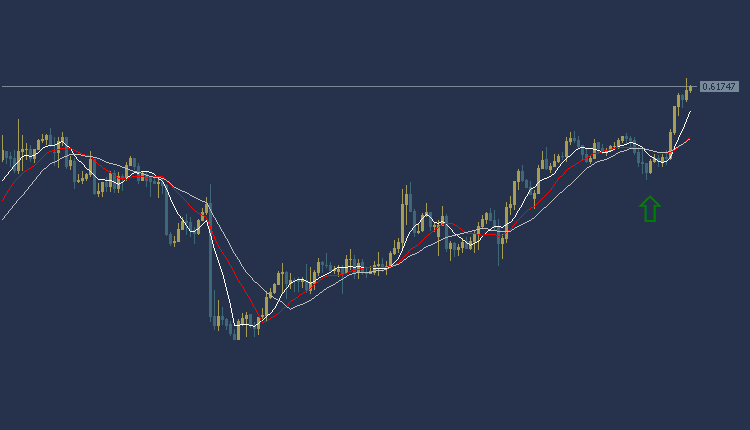
NZDUSD Technical Analysis: The NZDUSD is trading in an upward trend today during the American session. The NZDUSD price is trading at 0.6173, and trading appears above most of the moving average intersections. The MACD indicator also indicates positive signals
Based on this, we can look to buy from the rise to the price of 0.6184, and the targeted target could be the 0.6202 area. It is also recommended to choose the 0.6140 area as a stop loss point to control risk.
NZDUSD Technical Analysis: On the other hand
On the other hand, if the stop loss area at 0.6140 is broken, the NZDUSD price may head towards the 0.6125 level.
NZDUSD Technical Analysis: Resistance and Support:
• Second resistance: 0.6192
• First resistance: 0.6185
• Pivot level: 0.6178
• First support: 0.6164
• Second support: 0.6159
Dow Jones US30 Technical Analysis: is trading in downward trend
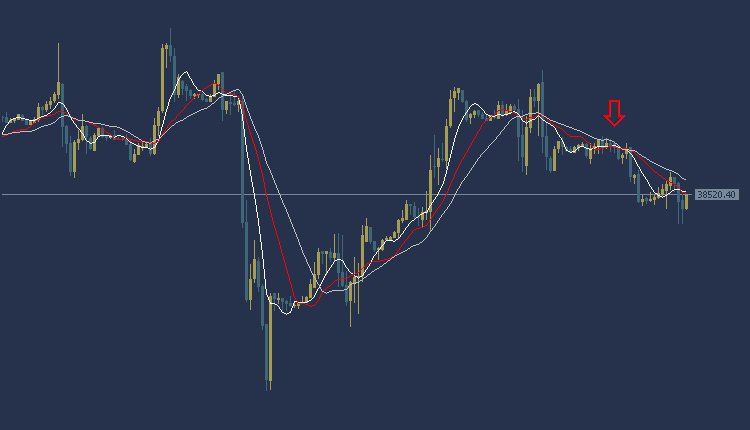
Dow Jones US30 Technical Analysis, the US30 Index is trading at $38504. According to technical analysis, the current trend is a downward trend in the American index prices. The price of the American index appears below most of the crossings of the moving averages, and the MACD indicator also shows negative signs
Accordingly, we expect the index to take a downward trend, so we will sell from the decline to the 38440 level, and we will also target the $38358 level as a profit-taking target. To ensure risk control, it is recommended to set a stop loss point at the $38597 area.
Dow Jones US30 Technical Analysis: On the other hand
In case the stop loss area at $38597 is broken, targeting the additional support level at $38662 could be achieved.
Dow Jones US30 Technical Analysis: resistance and support
Second resistance: 38573.30
Initial resistance: 38545.16
Pivot level: 38520.20
First support: 38483.80
Second support: 38455.90