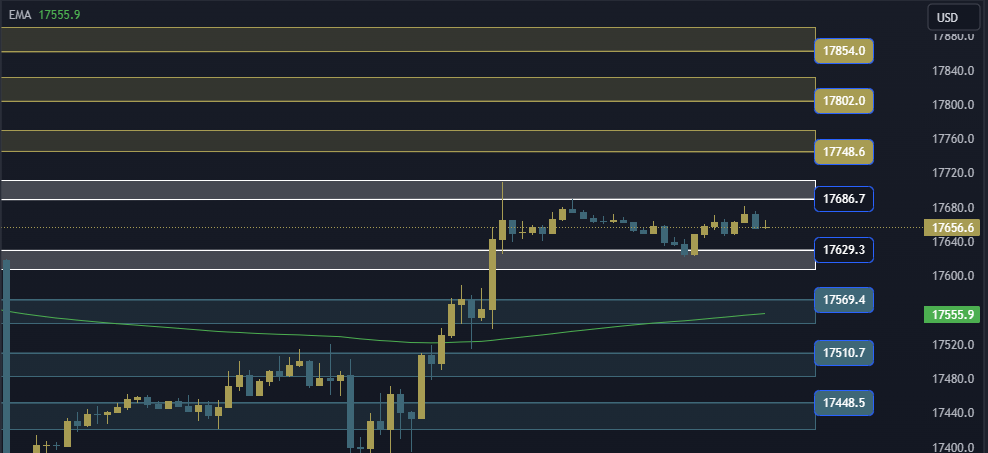
NAS100 NDX Technical Analysis The Nasdaq index is trading at the $17629/17686 area. In the event of an ascent and stability above the 17686 area, it will head to the first resistance area at 17748, and if the rise is completed, it will head to the 17802/17854 areas.
NAS100 NDX Technical Analysis On the other side
In the event of a decline and stability below the 17629 area, it will head to the first support area at 17569, and in the event of a complete decline, it will head to the 17510/17448 areas.
NAS100 NDX Technical Analysis: support and resistance levels
• Third resistance: 17854
• Second resistance: 17802
• First resistance: 17748
• Trading area: 17629/17686
• First support: 17569
• Second support: 17510
• Third support: 17448