
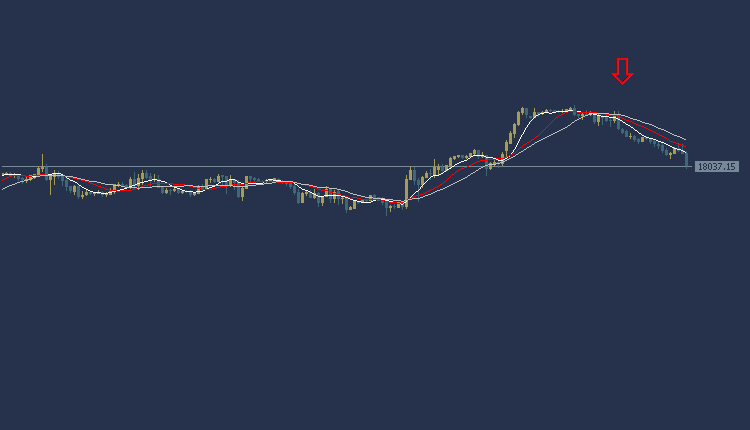
NAS100 NDX Technical Analysis, the Nasdaq is trading at $18,037. According to technical analysis, the current trend is a downward trend in the American index prices. The price of the American index appears below most of the crossings of the moving averages, and the MACD indicator also shows negative signs.
Accordingly, we expect the index to take a downward trend, so we will sell from the drop to the 17975 level, and we will also target the $17877 level as a profit-taking target. To ensure risk control, it is recommended to set a stop loss point at the $18,184 area.
NAS100 NDX Technical Analysis: on the other hand
In case the buy zone at $18,184 is broken, targeting additional support level at $18,256 could be achieved.
NAS100 NDX Technical Analysis resistance and support
- Second resistance: 18130.03
- Initial resistance: 18088.23
- Pivot level: 18055.12
- First support: 18000.74
- Second support: 17960.79
Gold Technical Analysis: bullish trend
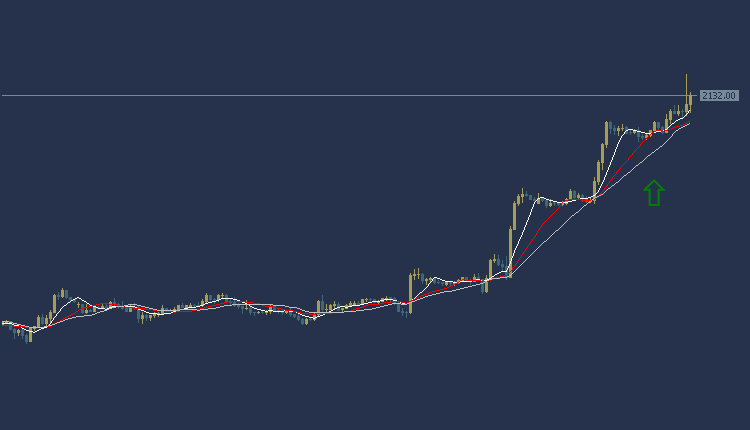
Gold Technical Analysis: The price of gold is trading today at $2132 per ounce. Trading appears in an upward trend, as the price of gold is trading above the intersections of the Moving Average indicators. As for the MACD indicator, it indicates positive signals.
Accordingly, we can look to buy from the rise to the price of $2140 per ounce, and target the $2149 per ounce area to take profits while setting the $2111 per ounce area as a stop loss.
Gold Technical Analysis: On the other hand
On the other hand, if the $2111 per ounce selling area is broken, the price may head to the $2100 per ounce area.
Gold Technical Analysis: resistance and support levels
- Second resistance: 2133.02
- First resistance: 2132.68
- Pivot level: 2132.30
- First support: 2131.85
- Second support: 2131.10
EURUSD Technical Analysis: an upward trend
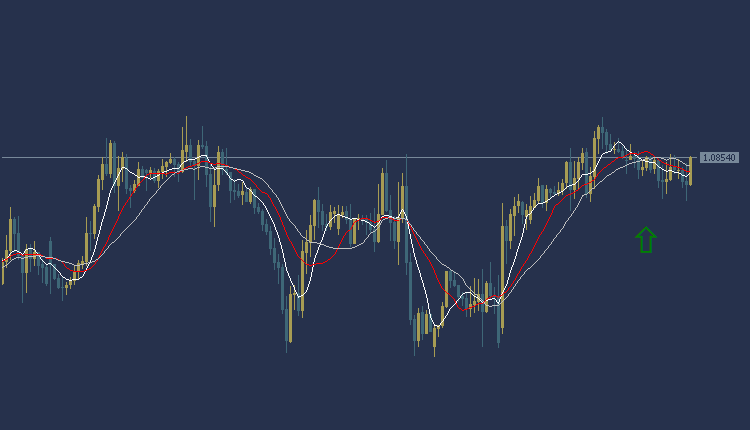
EURUSD Technical Analysis: The Euro/Dollar is in an upward trend today during the American session. The Euro/Dollar is trading at $1.0854, where prices appear to be trading above most of the moving average intersections shown on the chart. The MACD indicator also indicates a positive trend and, accordingly, we can look to buy from the rise to the price of $1.0860, and the target could be the $1.0872 area. It is also recommended to choose the $1.0836 area as a stop loss point to control risk.
EURUSD Technical Analysis: On the other hand
On the other hand, if the $1.0836 sell area is broken, the target is $1.0829.
EURUSD Technical Analysis: resistance and support levels
- Second resistance: 1.0874
- First resistance: 1.0867
- Pivot level: 1.0860
- First support: 1.0849
- Second support: 1.0840
Tesla Stock Technical Analysis: trading in a bearish trend today
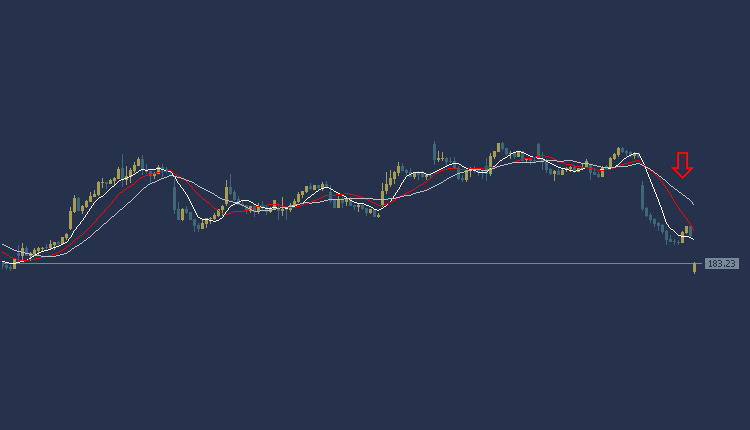
Tesla Stock Technical Analysis. Tesla stock is trading today in the American stock market at $183.23 per share. According to technical analysis, the current trend indicates a downward trend in Tesla stock prices. Tesla stock price reflects trading below most of the moving average crossings, and the MACD indicator is showing negative signs.
Accordingly, we expect Tesla’s share price to fall, so we can sell, waiting for the price to fall at the level of $179.19 per share to enter the selling process, and we target the level of $173.64 per share as a profit-taking target. To ensure risk control, it is recommended to set a stop loss point at $193.32 per share.
Tesla Stock Technical Analysis: On the other hand
If the buy zone of $193.32 per share is broken, the target will be $197.61 per share.
Tesla Stock Technical Analysis: resistance and support levels
- Second resistance: 189.09
- First resistance: 186.23
- Pivot level: 183.69
- First support: 180.85
- Second support: 178.73


