
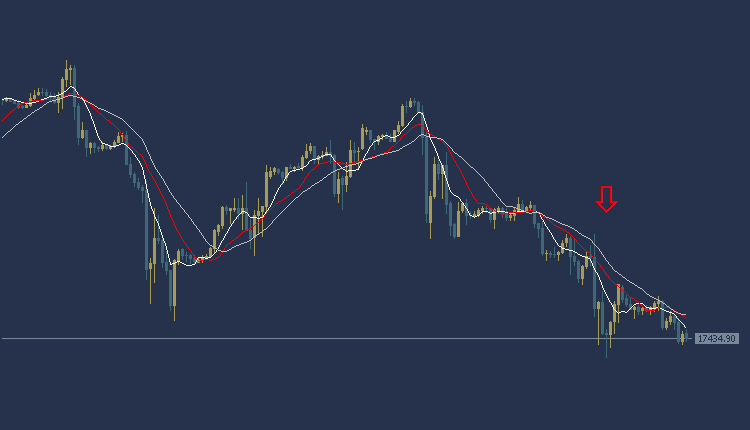
NAS100 NDX Technical Analysis is trading at $17431. According to technical analysis, the current trend is a downward trend in the American index prices. The price of the American index appears below most of the crossings of the moving averages, and the MACD indicator also shows negative signs.
Accordingly, we expect the index to take a downward trend, so we will sell from the decline to the level of 17371, and we will also target the level of $17270 as a profit-taking target. To ensure risk control, it is recommended to set a stop loss point at the $17571 area.
NAS100 NDX Technical Analysis: on the other hand
If the stop loss area at $17571 is broken, targeting the additional support level at $17649 could be achieved.
NAS100 NDX Technical Analysis resistance and support
- Second resistance: 17509.22
- Initial resistance: 17488.15
- Pivot level: 17460.12
- First support: 17403.60
- Second support: 17382.99
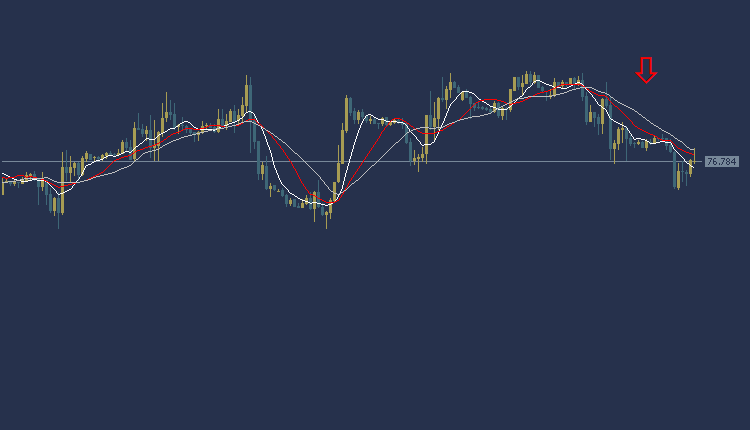
USOIL Technical Analysis: Oil prices decline
USOIL Technical Analysis, in the global oil market, the price is trading at the area of $76.77 per barrel. According to technical analysis, the current trend indicates a downward trend with prices trading below the moving average intersections, and the MACD indicator also shows a negative trend.
Accordingly, selling can fall to the price of 76.39, and we will target $75.77 per barrel as a profit-taking target. To ensure risk control, it is recommended to set the stop loss point at the $77.58 per barrel area.
USOIL Technical Analysis: On the other side
If the stop loss area at 77.58 per barrel is broken, targeting the additional support level at $78.02 per barrel could be achieved.
USOIL Technical Analysis: resistance and support levels
- Second resistance: 77.19
- First resistance: 76.96
- Pivot level: 76.85
- First support: 76.53
- Second support: 76.22
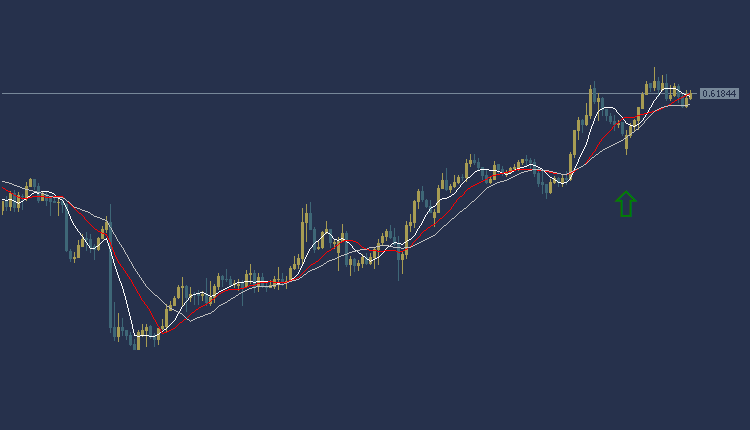
NZDUSD Technical Analysis: bullish trading
NZDUSD Technical Analysis: The NZDUSD is trading in an upward trend today during the American session. The NZDUSD price is trading at 0.6185, and trading appears above most of the moving average intersections. The MACD indicator also indicates positive signals.
Accordingly, we can look to buy from the rise to the price of 0.6198, and the targeted target could be the 0.6218 area. It is also recommended to choose the 0.6153 area as a stop loss point to control risk.
NZDUSD Technical Analysis: On the other hand
On the other hand, if the stop loss area at 0.6153 is broken, the NZDUSD price may head towards the 0.6134 level.
NZDUSD Technical Analysis: Resistance and Support:
- Second resistance: 0.6199
- First resistance: 0.6195
- Pivot level: 0.6188
- First support: 0.6180
- Second support: 0.6173
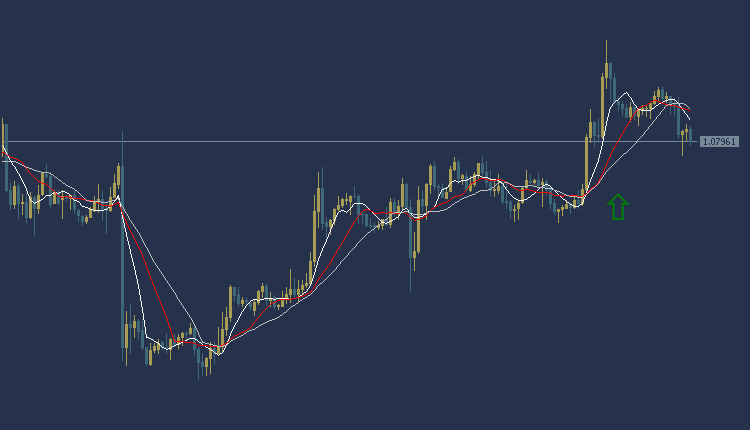
EURUSD Technical Analysis: an upward trend
EURUSD Technical Analysis, the EURUSD is in a weak upward trend during the American session. The EURUSD is trading at $1.0795, where prices appear to be trading above most of the moving average intersections shown on the chart. The MACD indicator also indicates a positive trend with a decline in buyer power. Accordingly, we can look to buy from the rise to the price of $1.0805, and the target could be the $1.0822 area. It is also recommended to choose the $1.0773 area as a stop loss point to control risk.
EURUSD Technical Analysis: On the other hand
On the other hand, if the stop loss area at $1.0773 is broken, the EURUSD price may head towards the $1.0760 level.
EURUSD Technical Analysis: resistance and support levels
- Second resistance: 1.0812
- First resistance: 1.0806
- Pivot level: 1.0800
- First support: 1.0790
- Second support: 1.0784


