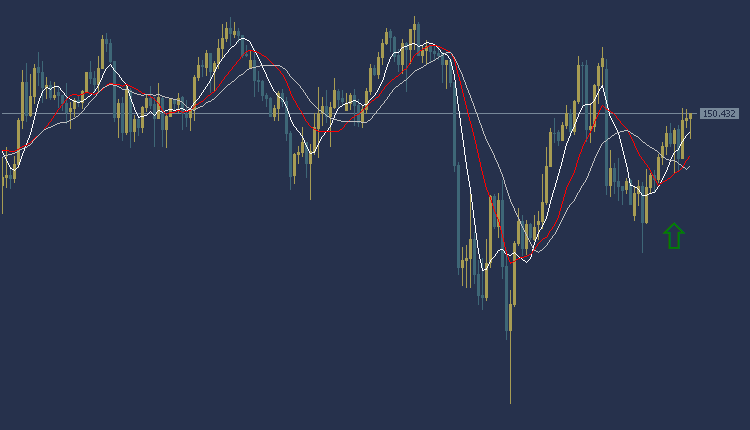
USDJPY Technical Analysis today in an upward trend during the American session. The price of the dollar/yen is trading at 150.43, and trading appears above most of the moving average intersections. Also, the MACD indicator indicates a positive trend
Accordingly, we can look to buy from the rise to the price of 150.53, with the targeted target being the 150.72 area. It is also recommended to choose the 150.16 area as a stop-loss point to control risks.
USDJPY Technical Analysis: on the other hand
On the other hand, if the stop loss area at 150.16 is broken, the USDJPY price may head towards the 150.03 level.
USDJPY Technical Analysis: resistance and support levels
• Second resistance: 150.68
• First resistance: 150.57
• Pivot level: 150.49
• First support: 150.34
• Second support: 150.26
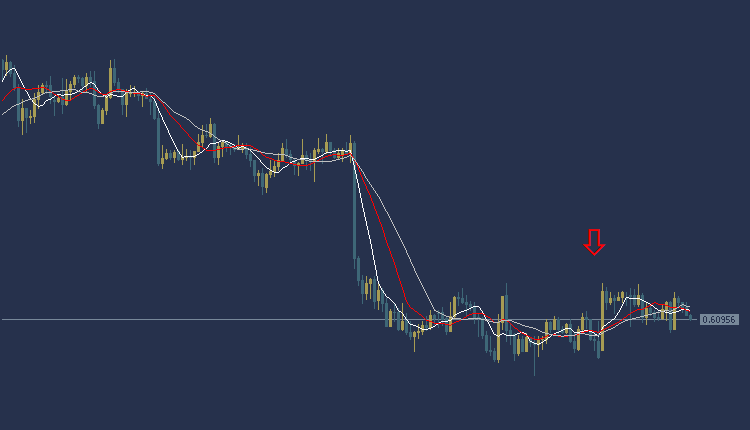
NZDUSD Technical Analysis: bearish trading
NZDUSD Technical Analysis: The New Zealand Dollar is trading today in a bearish direction during the American session, as the price of the New Zealand Dollar is trading at 0.6095, and trading appears below most of the moving average intersections. The MACD indicator also indicates negative signals
Accordingly, we can look to sell from the drop to the price of 0.6082, and the targeted target could be the 0.6058 area. It is also recommended to choose the 0.6129 area as a stop loss point to control risk.
NZDUSD Technical Analysis: On the other hand
On the other hand, if the buy zone at 0.6129 is broken, the New Zealand price may head towards the 0.6147 level.
NZDUSD Technical Analysis resistance and Support:
• Second resistance: 0.6117
• First resistance: 0.6109
• Pivot level: 0.6100
• First support: 0.6085
• Second support: 0.6071
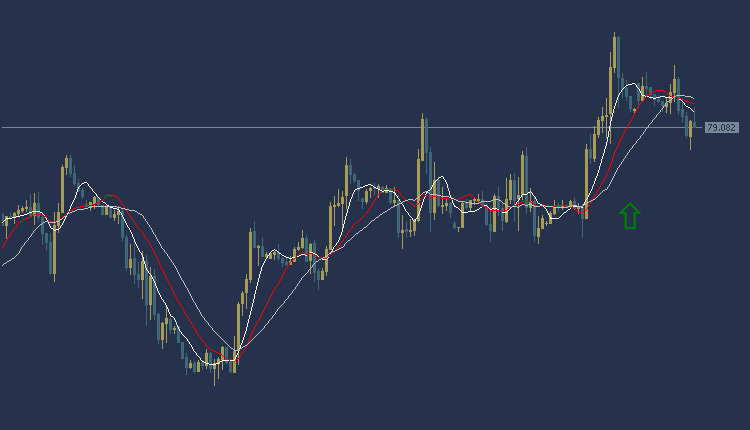
USOIL Technical Analysis: Oil prices rise
USOIL Technical Analysis, in the global oil market, the price is trading at the area of $79.08 per barrel. According to technical analysis, the current trend indicates an upward trend with prices trading above the crossings of the moving average, and the MACD indicator also shows a positive trend.
Accordingly, buying can rise to the price of 79.55, and we will target $80.30 per barrel as a profit-taking target. To ensure risk control, it is recommended to set the stop loss point at $78.03 per barrel.
USOIL Technical Analysis: On the other side
If the selling area of 78.03 per barrel is broken, the target will be $77.49 per barrel.
USOIL Technical Analysis: resistance and support levels
• Second resistance: 79.68
• First resistance: 79.38
• Pivot level: 79.16
• First support: 78.76
• Second support: 78.53
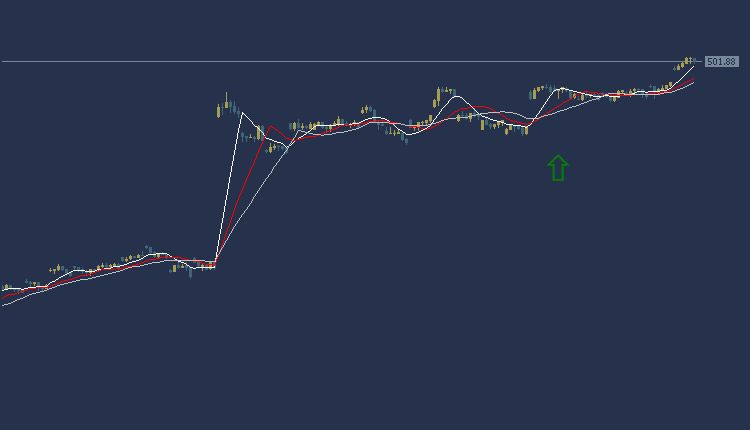
Facebook Stock Technical Analysis: trading in an upward trend
Facebook Stock Technical Analysis, Facebook stock is trading today in the American stock market at $501.88 per share. According to technical analysis, the current trend indicates an upward trend in Facebook share prices. Facebook share price reflects trading above most of the moving average intersections, and the MACD indicator is showing positive signs
Based on this, we expect the price of Facebook shares to rise, so we can buy and wait for the price to rise at the level of $510.36 per share to enter the purchase process, and we target the level of $522.94 per share as a profit-taking target. To ensure risk control, it is recommended to set the stop loss point at $480.57 per share.
Facebook Technical Analysis: On the other hand
If the stop loss area at $480.57 per share is broken, targeting the level of $469.22 per share can be achieved.
Facebook Stock Technical Analysis: Resistance and Support Levels
Second resistance: 506.09
First resistance: 504.12
Pivot level: 502.55
First support: 497.76
Second support: 495.80