USOil Technical Analysis, we find the price of oil trading at $72.88 per barrel. Based on current technical analysis, the current trend shows the beginning of an upward trend in oil prices. The strength of this trend indicates a clear rise in the price of oil, as most of the moving average intersections have been successfully crossed. But in addition, the MACD indicator provides signs of weak buying power.
Based on this analysis, we will wait for oil to rise to the target level of $73.36 per barrel, while choosing $74.23 as a profit-taking target. It is necessary to set a stop loss point at the $72.42 per barrel area to ensure that risks are controlled effectively.
USOil Technical Analysis: On the other hand
USOil Technical Analysis If the stop loss area at $72.42 per barrel is broken, the oil price could head towards the additional support level at $71.52 per barrel.
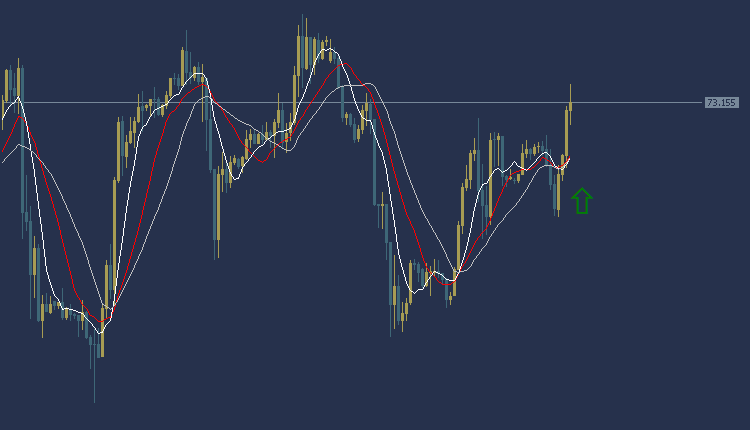
USOil Technical Analysis: resistance and support analysis
• Second resistance: 73.61
• First resistance: 73.34
• Pivot level: 72.83
• First support: 72.56
• Second support: 72.05
Dow Jones US30 Technical Analysis: The American index is trading in a bearish direction
Dow Jones US30 Technical Analysis: The Dow Jones Index is trading today at $37502. Based on current technical analysis, the current trend indicates an upward trend in the US index prices. The price of the American index shows weakness in most of the intersections of the moving averages, the MACD indicator provides positive signals, and weakness in buying power is observed.
Based on this analysis, we expect the uptrend in the Dow Jones to continue, so we will buy after the price rises to $37459, and our target profit target will be $37629. To ensure effective risk control, it is recommended to set the stop loss point at the level of $37458.
Dow Jones US30 Technical Analysis: On the other hand
Dow Jones US30 Technical Analysis If the stop loss area at $37458 is broken, the Dow Jones could head towards additional support at $37380.
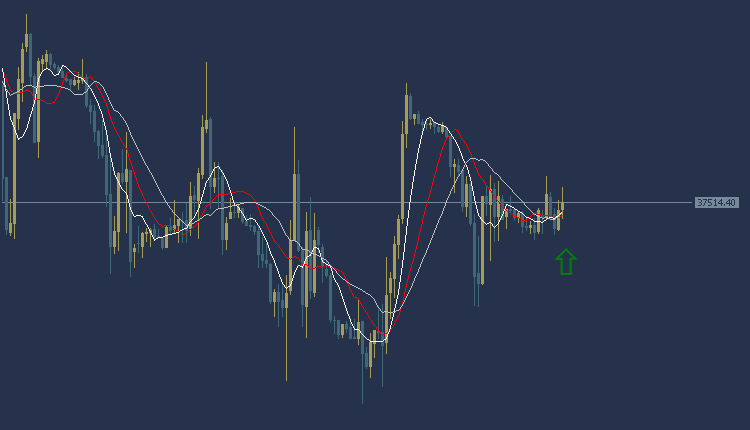
Dow Jones US30 Technical Analysis: resistance and support levels:
• Second resistance: 37585.17
• Initial resistance: 37553.29
• Pivot level: 37509.07
• First support: 37477.19
• Second support: 37432.97
GBPUSD Technical Analysis: It is trading in an upward trend
GBPUSD Technical Analysis: The pound dollar is trading in an upward trend today during the American session. The pound is trading at $1.2730, as shown in the chart shown above most of the moving average intersections. The MACD indicator indicates a positive trend indicating a weakness in selling power.
Based on the chart, we can make a purchase while waiting for the price of the pound to rise at the $1.2742 area, and the target could be the $1.2772 area. It is also recommended to choose the $1.2713 area as a stop loss point to control risks.
GBPUSD Technical Analysis: On the other hand
GBPUSD Technical Analysis On the other hand, if the stop loss area at $1.2713 is broken, the pound price may head towards the $1.2685 level.
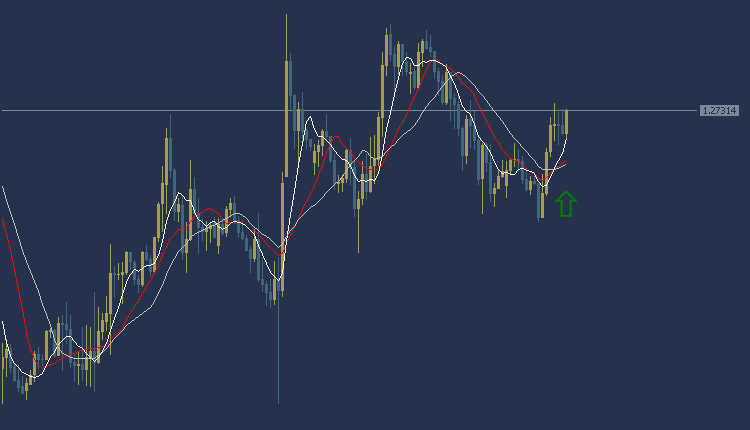
GBPUSD Technical Analysis: resistance and support levels
• Second resistance: 1.2708
• First resistance: 1.2698
• Pivot level: 1.2692
• First support: 1.2682
• Second support: 1.2676
GBPJPY Technical Analysis: Today it is trading in an upward trend
GBPJPY Technical Analysis, the pound is trading in an upward trend during the American session. The pound is trading at 184.77, and trading appears above most of the moving average intersections. The MACD indicator also indicates a positive trend indicating the presence of buying power.
Accordingly, we can look to buy, waiting for the price of the pound yen pair to rise at the 185.34 area, and the target could be the 186.35 area. It is also recommended to choose the 184.20 area as a stop-loss point to control risks.
GBPJPY Technical Analysis: on the other hand
GBPJPY Technical Analysis On the other hand, if the stop loss area at 184.20 is broken, the pound price may head towards the 183.03 level.
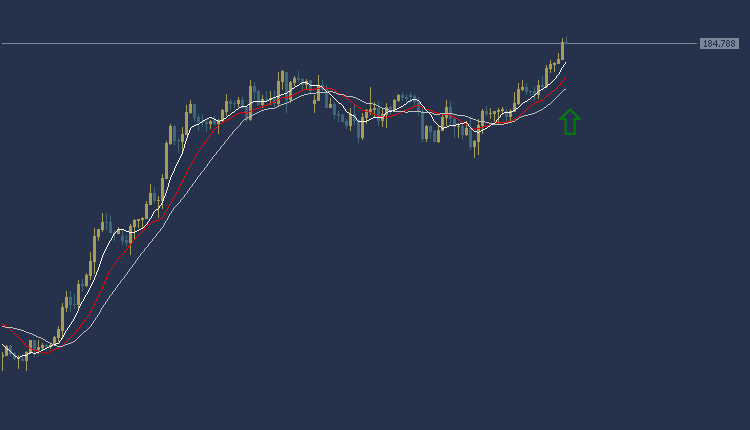
GBPJPY Technical Analysis: resistance and support levels
• Second resistance: 184.33
• First resistance: 184.19
• Pivot level: 184.00
• First support: 183.86
• Second support: 183.67