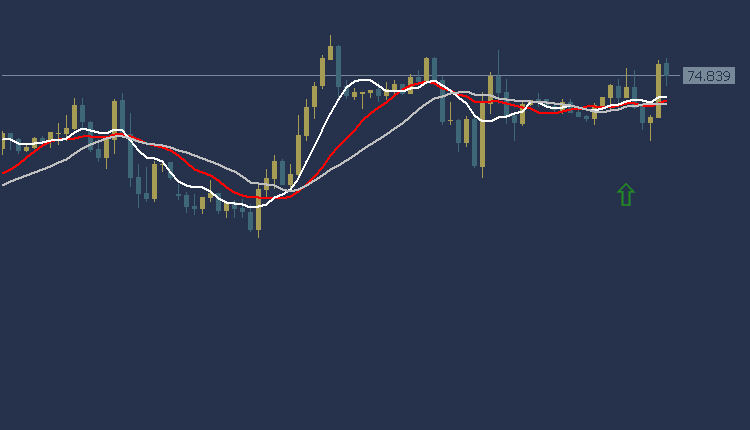
USOIL Technical Analysis Today, we find the price of oil trading at $74.46 per barrel. Based on current technical analysis, the current trend shows an upward trend in oil prices. The strength of this trend indicates a clear rise in the price of oil, as most of the moving average intersections were trading above. In addition, the MACD indicator provides strength signals to buy.
Based on this analysis, we will wait for oil to rise to the target level of $75.05 per barrel, while choosing $75.74 as a profit-taking target. It is necessary to set a stop loss point at the $73.45 area
USOIL Technical Analysis: on the other hand
If the stop loss area at $73.45 per barrel is broken, the oil price could head towards $72.74 per barrel.
USOIL Technical Analysis: resistance and support levels
- • Second resistance: 74.54
- • First resistance: 74.41
- • Pivot level: 74.19
- • First support: 74.06
- • Second support: 73.84
Facebook Stock Technical Analysis: is trading in an upward trend
Facebook Stock Technical Analysis Today, Facebook stock is trading today in the American stock market at $05.385 per share. According to technical analysis, the current trend indicates an upward trend in Facebook share prices. Facebook’s share price reflects upward strength by exceeding most of the moving average intersections, and the MACD indicator also shows positive signs, with strength to buy.
Accordingly, we expect the price of Facebook shares to fall, so we can buy, waiting for the price to rise at the level of $389.48 per share to enter the purchase process, and we target the level of $402.05 per share as a profit-taking target. To ensure risk control, it is recommended to set the stop loss point at $374.13 per share.
Facebook Stock Technical Analysis: On the other hand
If the stop loss area at $374.13 per share is broken, the target level at $363.97 per share can be achieved.

Facebook Stock Technical Analysis: Resistance and Support Levels
- Second resistance: 400.00
- First resistance: 390.50
- Pivot level: 385.50
- First support: 370.50
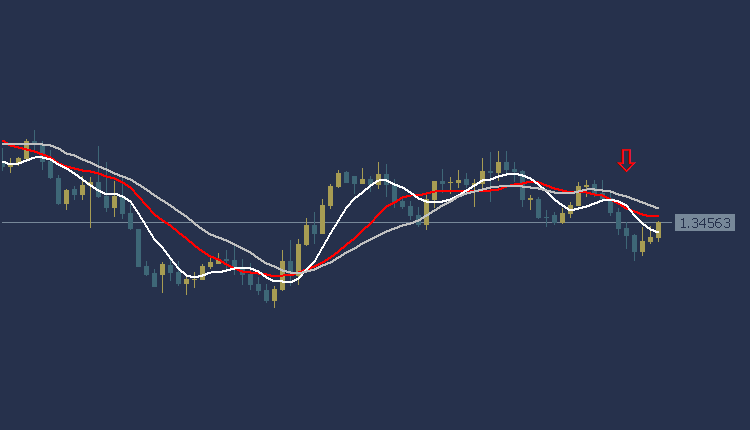
USDCAD Technical Analysis: is trading in a general bearish trend
USDCAD Technical Analysis, where the Canadian dollar is trading at 1.3456 during the American session, and appears trading below most of the moving average intersections. The MACD indicator also indicates a negative trend indicating strong selling.
Accordingly, we can consider selling, waiting for the price to fall at the level of 1.3432, and the target could be the 1.3411 area. It is also recommended to choose the 1.3487 area as a stop loss point to control risk.
USDCAD Technical Analysis: On the other hand
If the stop loss area at 1.3487 is breached, the price of the Canadian dollar may head towards the 1.3512 level.
USDCAD Technical Analysis: for resistance and support levels
- • Second resistance: 1.3462
- • First resistance: 1.3455
- • Pivot level: 1.3448
- • First support: 1.3441
- • Second support: 1.3434
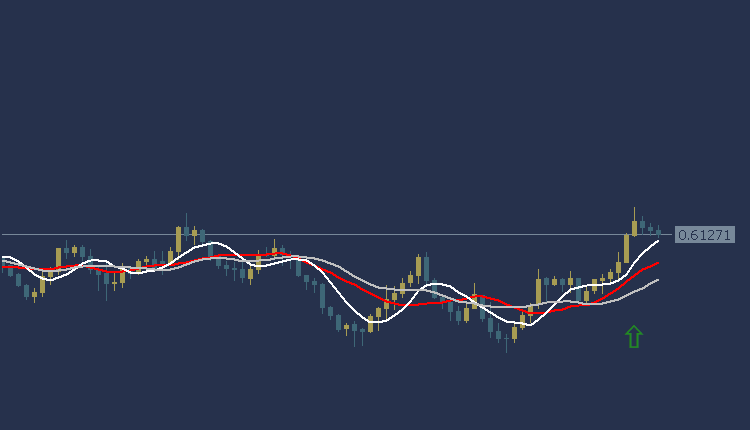
NZDUSD Technical Analysis: is trading in an upward trend
NZDUSD Technical Analysis today in an upward trend during the American session. The New Zealand dollar is trading at 0.6127, and trading appears above most of the moving average intersections. The MACD indicator also indicates strength in the upward trend
Accordingly, we can consider buying while waiting for the price of the New Zealand Dollar pair to break through at the level of 0.6156, and the target could be the 0.6189 area. It is also recommended to choose the 0.6091 area as a stop loss point to control risk.
NZDUSD Technical Analysis: On the other side
On the other hand, if the stop loss area at 0.6091 is broken, the New Zealand dollar price may head towards the 0.6062 level.
NZDUSD Technical Analysis: resistance and support levels
- • Second resistance: 0.6142
- • First resistance: 0.6137
- • Pivot level: 0.6132
- • First support: 0.6127
- • Second support: 0.6122