
Oil price today, in the global oil market, the price is trading at the area of $79.20 per barrel. According to technical analysis, the current trend indicates an upward trend with prices trading above the crossings of the moving average, and the MACD indicator also shows a positive trend.
Accordingly, buying can rise to the price of 79.79, and we will target $80.55 per barrel as a profit-taking target. To ensure risk control, it is recommended to set a stop loss point at the $78.06 per barrel area.
USOIL Technical Analysis: On the other side
If the selling area of 78.06 per barrel is broken, the target will be $77.42 per barrel.
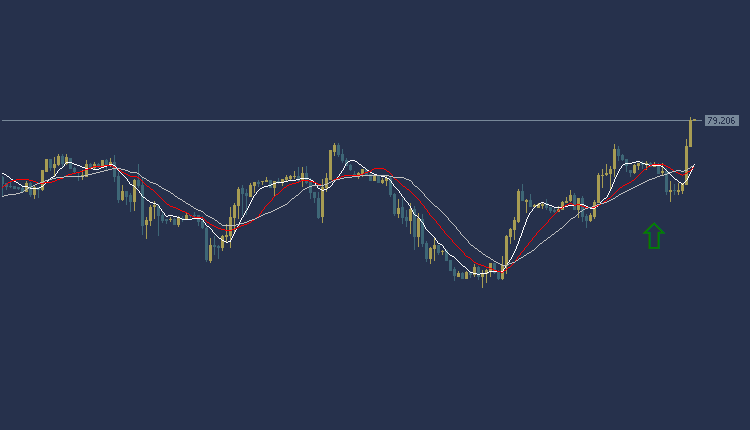
USOIL Technical Analysis: resistance and support levels
- Second resistance: 79.83
- First resistance: 79.60
- Pivot level: 79.30
- First support: 79.00
- Second support: 78.80
EURUSD Technical Analysis: bearish trading
EURUSD Technical Analysis: The Euro/Dollar is in a downward trend today during the American session. The Euro/Dollar is trading at $1.0822, where prices appear to trade below most of the moving average intersections shown on the chart. The MACD indicator also indicates a negative trend and, accordingly, we can look to sell from a drop to the price of $1.0816, and the target could be the $1.0801 area. It is also recommended to choose the $1.0850 area as a stop loss point to control risks.
EURUSD Technical Analysis: On the other hand
On the other hand, if the $1.0850 buy zone is broken, the target is $1.0864.
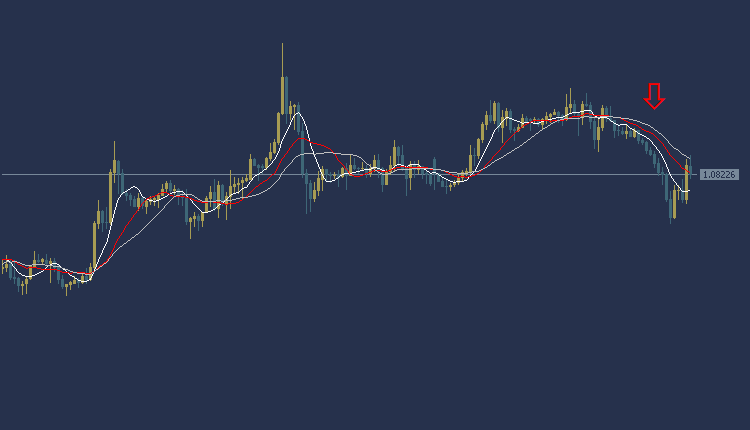
EURUSD Technical Analysis: resistance and support levels
- Second resistance: 1.0843
- First resistance: 1.0831
- Pivot level: 1.0826
- First support: 1.0812
- Second support: 1.0806
Dow Jones US30 Technical Analysis: is trading in downward trend
Dow Jones US30 Technical Analysis is trading at $38,795. According to technical analysis, the current trend is a downward trend in the American index prices. The price of the American index appears below most of the crossings of the moving averages, and the MACD indicator also shows negative signs
Accordingly, we expect the index to take a downward trend, so we will sell from the decline to the 38692 level, targeting the $38604 level as a profit-taking target. To ensure risk control, it is recommended to set a stop loss point at the $38,923 area.
Dow Jones US30 Technical Analysis: On the other hand
In case the $38,923 buy zone is broken, the target is $38,998.
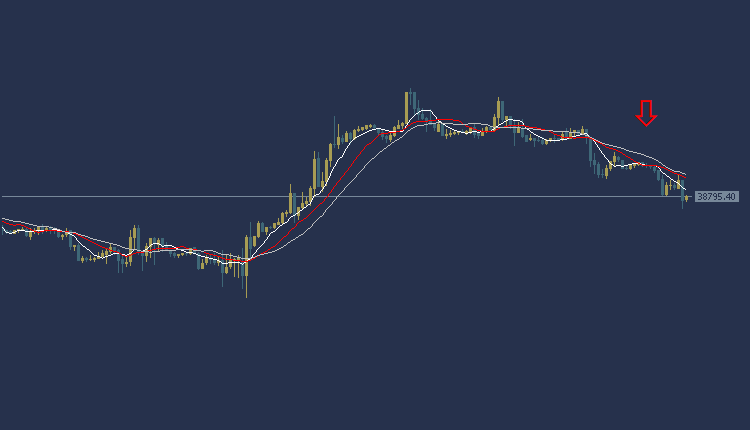
Dow Jones US30 Technical Analysis: resistance and support
- Second resistance: 38915.24
- Initial resistance: 38870.20
- Pivot level: 38826.10
- First support: 38734.70
- Second support: 38700.87
Facebook Stock Technical Analysis: is trading in upward trend
Facebook Stock Technical Analysis, Facebook shares are trading today in the American stock market at $486.93 per share. According to technical analysis, the current trend indicates an upward trend in Facebook share prices. Facebook share price reflects trading below most of the moving average intersections, and the MACD indicator is showing positive signs
Based on this, we expect the price of Facebook shares to rise, so we can buy, waiting for the price to rise at the level of $493.53 per share to enter the purchase process, and we target the level of $503.86 per share as a profit-taking target. To ensure risk control, it is recommended to set the stop loss point at $472.18 per share.
Facebook Stock Technical Analysis: On the other hand
If the selling zone at $472.18 per share is broken, targeting the $461.85 per share level could be achieved.
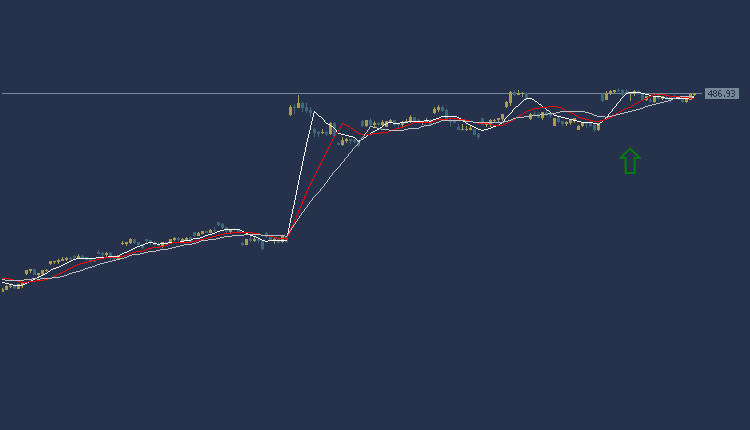
Facebook Stock Technical Analysis: Resistance and Support Levels
- Second resistance: 490.19
- First resistance: 489.33
- Pivot level: 487.25
- First support: 484.76
- Second support: 482.86


