USOIL Technical Analysis, in the global oil market, the price is trading at the area of $76.76 per barrel. According to technical analysis, the current trend indicates an upward trend with prices trading below the moving average intersections, and the MACD indicator also shows a positive trend.
Accordingly, buying can rise to the price of 77.39, and we will target $78.27 per barrel as a profit-taking target. To ensure risk control, it is recommended to set a stop loss point at $75.43 per barrel.
USOIL Technical Analysis: On the other side
If the stop loss area at 75.43 per barrel is broken, targeting the additional support level at $74.70 per barrel could be achieved.

USOIL Technical Analysis: resistance and support levels
• Second resistance: 77.06
• First resistance: 76.99
• Pivot level: 76.83
• First support: 76.55
• Second support: 76.33
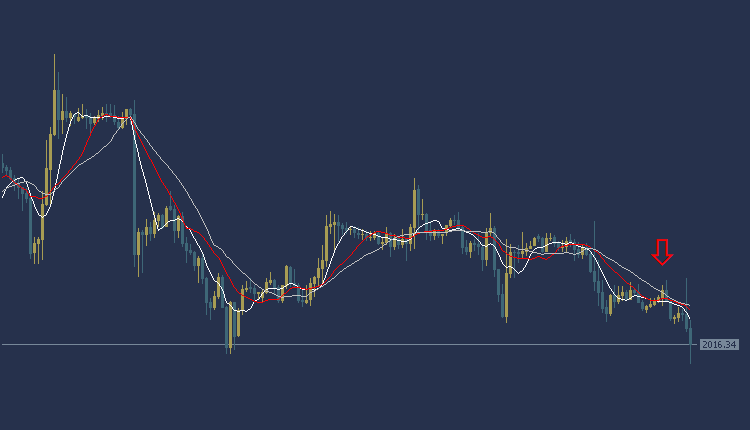
Gold Technical Analysis: Gold prices falling
Gold Technical Analysis The price of gold is trading today at $2016 per ounce. Trading appears in a downward trend, as the price of gold is trading below the intersections of the Moving Average indicators. As for the MACD indicator, it indicates negative signals.
Accordingly, we can look to sell from the decline to the price of $2011 per ounce, and target the $2004 per ounce area to take profits while setting the $2028 per ounce area as a stop loss.
Gold Technical Analysis: On the other hand
On the other hand, if the stop loss area of $2028 per ounce is broken, the price may head to the $2033 per ounce area.
Gold Technical Analysis: resistance and support levels
• The Second Resistance: 2018.12
• First resistance: 2017.25
• Pivot level: 2016.55
• First support: 2015.70
• Second support: 2014.89
EURUSD Technical Analysis: Sideways Trading
EURUSD Technical Analysis, the EURUSD is at the beginning of a downward trend within the sideways trend during the American session. The EURUSD is trading at $1.0771, where prices appear to trade below most of the moving average intersections shown on the chart. The MACD indicator also indicates a weak positive trend and the emergence of a sign of a negative trend. Accordingly, we can look to sell from a decline to the price of $1.0754, and the target could be the $1.0732 area. It is also recommended to choose the $1.0802 area as a stop loss point to control risk.
EURUSD Technical Analysis: On the other hand
On the other hand, if the stop loss area at $1.0802 is broken, the euro price may head towards the $1.0819 level.

EURUSD Technical Analysis: resistance and support levels
• Second resistance: 1.0783
• First resistance: 1.0778
• Pivot level: 1.0773
• First support: 1.0760
• Second support: 1.0756
Dow Jones US30 Technical Analysis: upward trend has declined
Dow Jones US30 Technical Analysis is trading at $38677. According to technical analysis, the current trend is a weak upward trend and the beginning of the emergence of a downward trend in the American index prices. The price of the American index appears below most of the crossings of the moving averages, and the MACD indicator also shows weak positive signals as a result of the seller’s pressure on the buyer.
Accordingly, we expect the index to take a downward trend, so we will sell from the decline to the 38627 level, and we will also target the $38557 level as a profit-taking target. To ensure risk control, it is recommended to set a stop loss point at the $38771 area.
Dow Jones US30 Technical Analysis: On the other hand
If the stop loss area at $38771 is broken, targeting the additional support level at $38833 could be achieved.

Dow Jones US30 Technical Analysis resistance and support
Second resistance: 38840.30
Initial resistance: 38818.09
Pivot level: 38780.20
First support: 38610.80
Second support: 38573.96