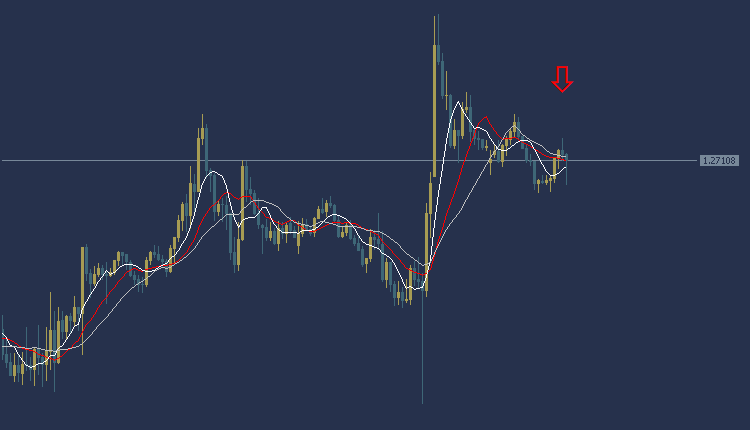
GBPUSD Technical Analysis Today, the pound dollar is trading in a bearish direction during the European session. The pound is trading at $1.2709, and as the chart shows, the pound is trading weakly at the intersections of the moving averages. The MACD indicator also indicates a positive trend indicating a weakness in buying power.
Accordingly, we can carry out the selling process by waiting for the price of the pound-dollar pair to fall to the area of $1.2696, and the target could be the area of $1.2679. It is also recommended to choose the $1.2718 area as a stop loss point to control risks.
GBPUSD Technical Analysis: On the other hand
On the other hand, if the stop loss area at $1.2718 is broken, the pound price may head towards the $1.2736 level.
GBPUSD Technical Analysis: resistance and support levels
Second resistance: 1.2725
First resistance: 1.2720
Pivot level: 1.2711
First support: 1.2706
Second support: 1.2697
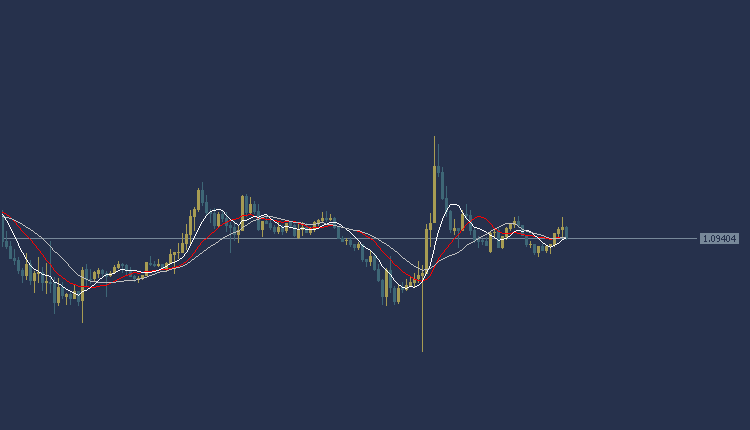
EURUSD Technical Analysis: It trades in a sideways direction
EURUSD Technical Analysis Today, is trading in a sideways trend during the European session. We advise against trading in the EUR/USD until clear signals confirm the trend
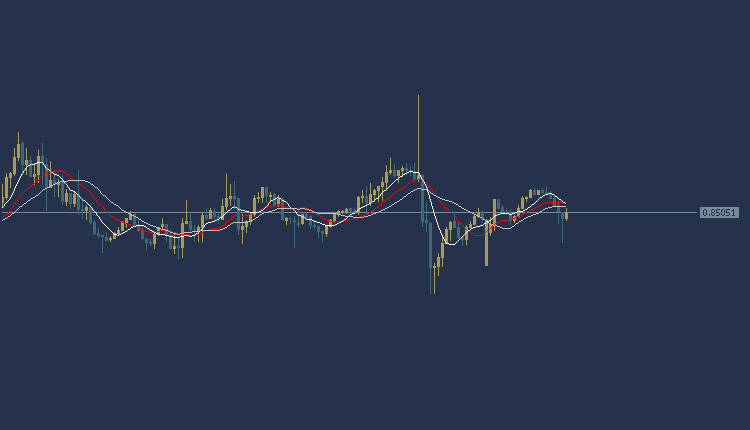
USDCHF Technical Analysis: It trades in a sideways direction
USDCHF Technical Analysis: The dollar and franc are trading in a sideways trend today during the European session. We advise against trading the dollar and the franc until clear signals confirm the trend
Gold Technical Analysis : today’s gold price
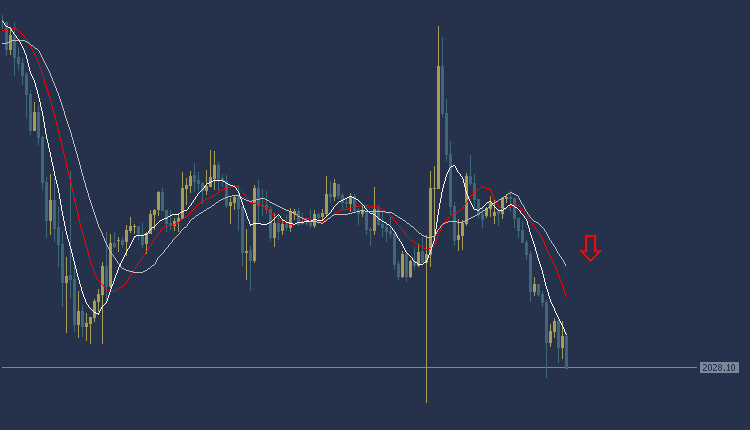
gold price Today’s against the dollar during the European session is taking a bearish trend. Gold is trading at $2028 per ounce, and trading appears below most of the moving average intersections, as shown in the chart. The MACD indicator also indicates a negative trend indicating the presence of selling power.
Accordingly, we can sell while waiting for the price of the yellow metal, gold, to fall to the region of $2025 per ounce, and the target could be the $2020 region per ounce. It is also recommended to choose the $2031 per ounce area as a stop loss point to control risk.
Gold Technical Analysis: On the other hand
On the other hand, if the stop loss area at $2031 per ounce is broken, the gold price may head towards the $2036 per ounce level.
Gold Technical Analysis: resistance and support levels
• Second resistance: 2041.88
• First resistance: 2039.81
• Pivot level: 2037.38
• First support: 2035.31
• Second support: 2032.88