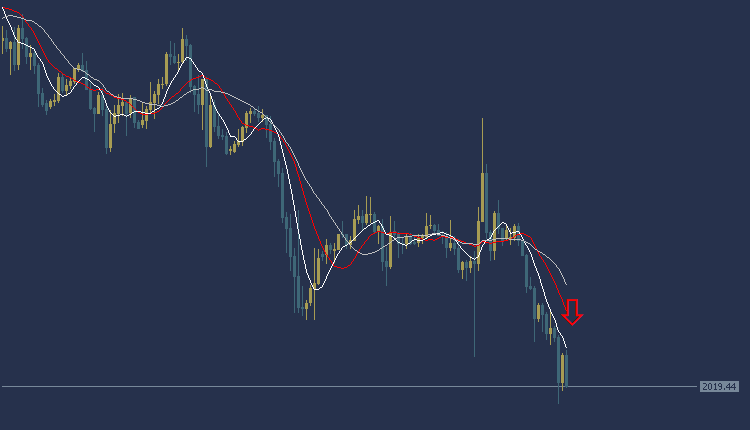
Gold price Today’s XAUUSD, in the current American trading session, shows a downward trend. Gold is currently trading at $2019 per ounce. What is noteworthy is trading below most of the moving average crossings, as can be clearly seen in the chart. For reference, the MACD indicator shows a negative trend, which indicates the emergence of selling power.
Based on this analysis, we can consider a selling opportunity while waiting for the gold price to fall to the target area of $2015 per ounce, and the next target may reach the $2009 per ounce area. It is also preferable to set the $2023 per ounce area as a stop-loss point, in order to contribute to effective risk management.
Gold price Today’s XAUUSD: On the other hand
Gold Price Today On the other hand, if the stop loss area at $2023 per ounce is broken, this could lead to a decline in the gold price towards the $2028 per ounce level.
Gold price Today’s XAUUSD: resistance and support levels
Second resistance: 2035.15
First resistance: 2033.05
Pivot level: 2029.15
First support: 2027.05
Second support: 2023.15
USOil Technical Analysis: Analysis of today’s oil price USOIL
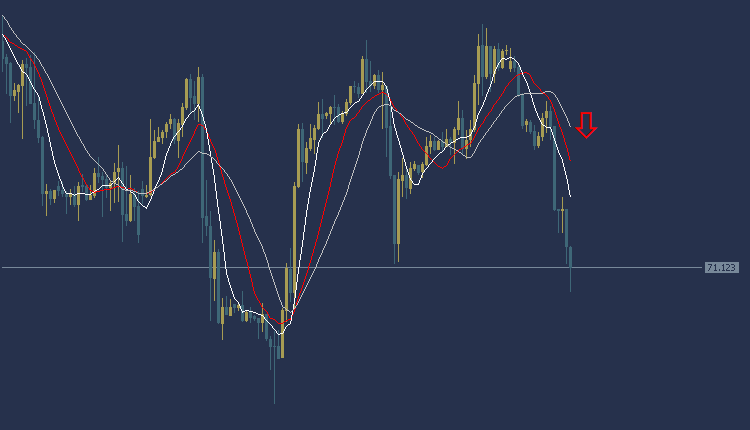
USOil Technical Analysis, we find the price of oil trading at $70.79 per barrel. Based on current technical analysis, the current trend shows the beginning of a downward trend in oil prices. The strength of this trend indicates a clear decline in the price of oil, as most of the moving average intersections have been successfully crossed. But in addition, the MACD indicator provides strong selling signals.
Based on this analysis, we will wait for the oil price to fall to the target level of $70.48 per barrel, while choosing $69.63 as the target to take profits. It is necessary to set a stop loss point at the $71.37 per barrel area to ensure that risks are controlled effectively.
USOil Technical Analysis: On the other hand
USOil Analysis on the other hand, if the stop loss area at $71.37 per barrel is broken, the oil price could head towards the additional support level at $72.26 per barrel.
USOil Technical Analysis: resistance and support levels
• Second resistance: 72.20
• First resistance: 72.01
• Pivot level: 71.76
• First support: 71.57
• Second support: 71.32
Dow Jones US30 Technical Analysis: The American index is trading in a bearish direction
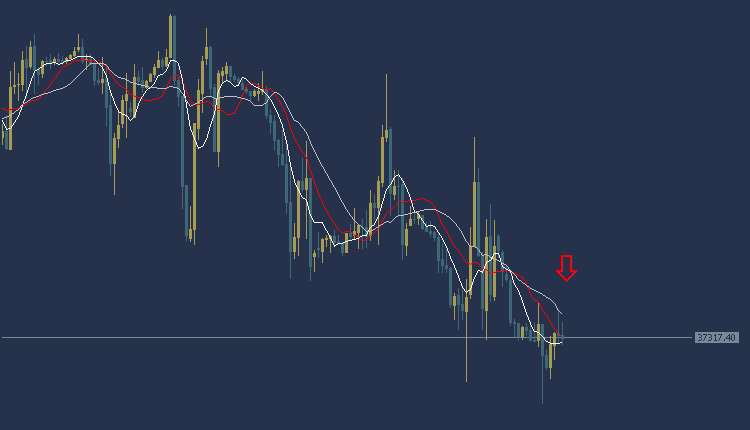
Dow Jones US30 Technical Analysis: Dow Jones US30 Index is trading Today at $37299. Based on current technical analysis, the current trend indicates a decline in the US index prices. The price of the American index appears below most of the intersections of the moving averages, the MACD indicator provides negative signals, and weakness in selling power is observed.
Based on this analysis, we expect the downtrend in the Dow Jones to continue, so we will sell after the price drops to $37246, and our target profit target will be at $37182. To ensure effective risk control, it is recommended to set the stop loss point at $37335.
Dow Jones US30 Technical Analysis: On the other hand
Dow Jones US30 analysis: On the other hand, if the stop loss area at $37335 is broken, the Dow Jones index could head towards the additional support level at $37391.
Dow Jones US30 Technical Analysis: resistance and support levels
• Second resistance: 37410.84
• Initial resistance: 37245.48
• Pivot level: 37447.01
• First support: 36995.29
• Second support: 36910.46
GBPJPY Technical Analysis: Today it is trading in an upward trend
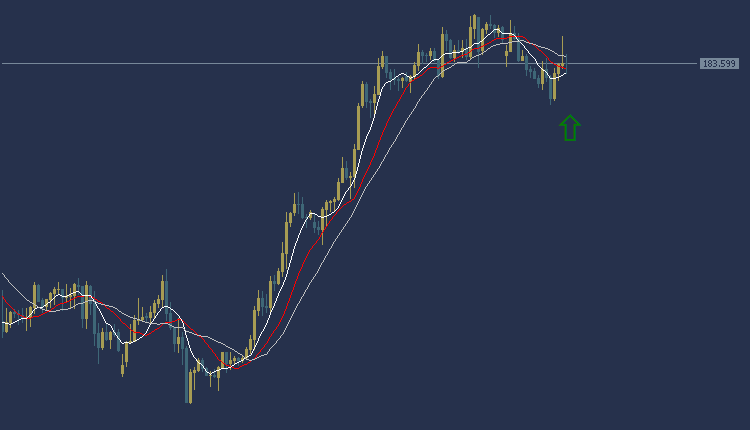
GBPJPY Technical Analysis: the pound is trading Today, in an upward trend during the American session. The pound is trading at 183.57, and trading appears above most of the moving average intersections. The MACD indicator also indicates a positive trend indicating a weakness in buying power.
Accordingly, we can look to buy, waiting for the price of the pound yen pair to rise at the 184.05 area, and the target could be the 184.74 area. It is also recommended to choose the 183.19 area as a stop-loss point to control risks.
GBPJPY Technical Analysis: on the other hand
GBPJPY Analysis On the other hand, if the stop loss area at 183.19 is broken, the GBPJPY price may head towards the 182.53 level.
GBPJPY Technical Analysis: resistance and support levels
• Second resistance: 183.25
• First resistance: 183.43
• Pivot level: 183.72
• First support: 183.90
• Second support: 184.19