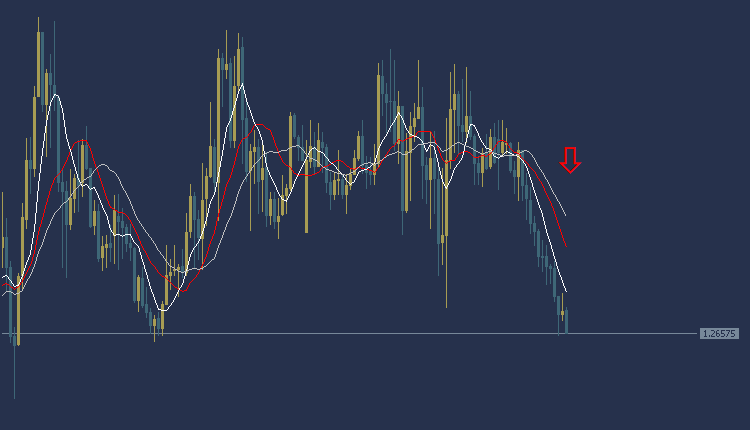
Analysis of the pound dollar: The pound dollar is trading in a bearish trend today during the European session. The pound is trading at $1.2657, as shown in the chart shown below most of the moving average intersections. The MACD indicator also indicates a negative trend indicating the presence of selling power.
Accordingly, we can carry out a selling operation if the price of the pound/dollar pair breaks the $1.2637 area, and the target could be the $1.2607 area. It is also recommended to choose the $1.2670 area as a stop loss point to control risks.
GBPUSD Technical Analysis: On the other hand
On the other hand, if the support area at $1.2670 is broken, the pound price may head towards the $1.2800 level.
GBPUSD Technical Analysis: resistance and support levels
• Second resistance: 1.2671
• First resistance: 1.2664
• Pivot level: 1.2661
• First support: 1.2655
• Second support: 1.2651
EURUSD Technical Analysis: It is trading in a downward trend
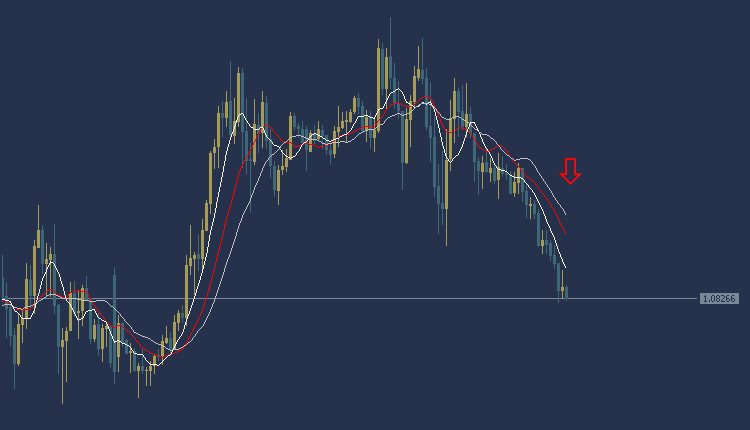
EURUSD Technical Analysis, The EUR/USD is trading in a bearish trend today during the European session. The euro is trading at $1.0826, and as the chart shows, trading is below most of the moving average intersections. The MACD indicator also indicates a negative trend indicating the presence of selling power.
Accordingly, we can carry out a selling operation if the Euro/Dollar price breaks at the $1.0800 level, and the target could be the $1.0770 area. It is also recommended to choose the $1.0840 area as a stop loss point to control risk.
EURUSD Technical Analysis: On the other hand
On the other hand, if the support area at $1.0840 is broken, the euro price may head towards the $1.0870 level.
EURUSD Technical Analysis: resistance and support levels
• Second resistance: 1.0836
• First resistance: 1.0831
• Pivot level: 1.0828
• First support: 1.0823
• Second support: 1.0820
Gold Technical Analysis: gold price today
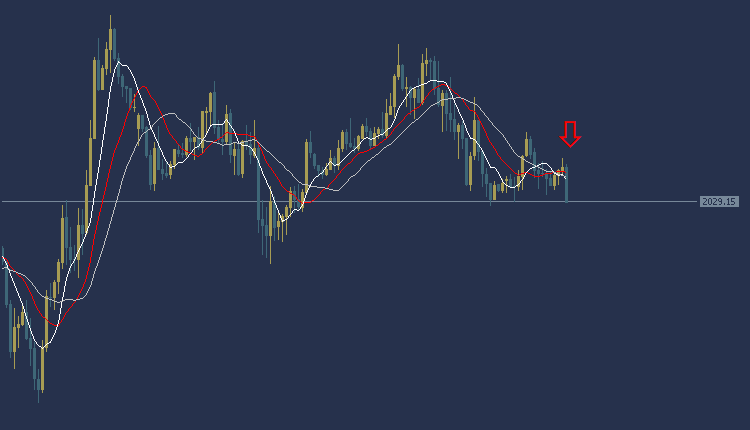
Technical analysis of gold, the price of gold today against the dollar during the European session is in a general bearish trend. Gold is trading at $2029 per ounce, and trading appears below most of the moving average intersections, as shown in the chart. The MACD indicator also indicates a negative trend indicating the presence of selling power.
Accordingly, we can sell while waiting for the price of yellow gold to fall to the region of $2026 per ounce, and the target could be the $2022 region per ounce. It is also recommended to choose the $2032 per ounce area as a stop loss point to control risk.
Gold Technical Analysis: On the other hand
On the other hand, if the support area at $2032 per ounce is broken, the gold price may head towards the $2036 per ounce level.
Gold Technical Analysis: resistance and support levels
• Second resistance: 2040.63
• First resistance: 2040.21
• Pivot level: 2039.53
• First support: 2039.11
• Second support: 2038.43