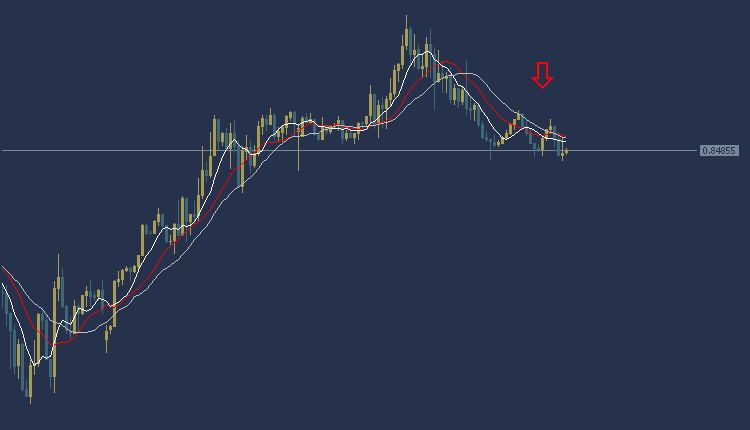
The USDCHF dollar and franc are trading in a bearish trend today during the European session. The dollar and franc are trading at $0.8484, and trading appears as shown in the chart under most moving average intersections. The MACD indicator also indicates the emergence of a negative trend indicating a weakness in selling power.
Accordingly, we can carry out a selling operation after the fall in the price of the dollar franc to the region of $0.8468, and the target could be the region of $0.8438. It is also recommended to choose the $0.8500 area as a stop loss point to control risk.
USDCHF Technical Analysis: On the other hand
On the other hand, if the stop loss area at $0.8500 is broken, the USD/CHF price may head towards the $0.8530 level.
USDCHF Technical Analysis: resistance and support levels
• Second resistance: 0.8472
• Initial resistance: 0.8477
• Pivot: 0.8488
• First support: 0.8493
• Second support: 0.8504
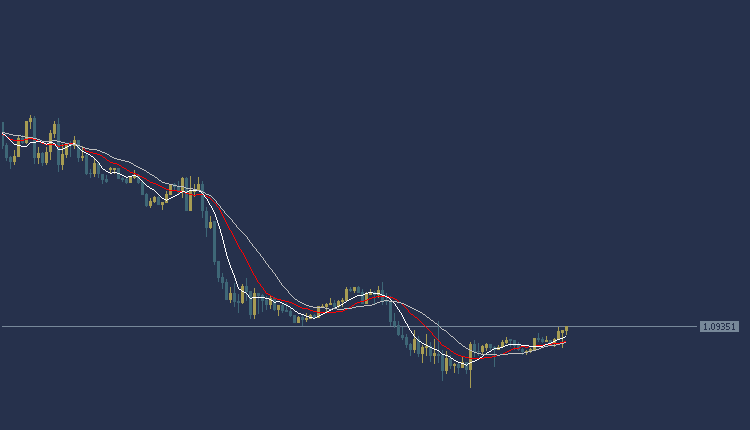
EURUSD Technical Analysis: It trades in a sideways direction
the EURUSD Today, is trading in a sideways trend during the European session. We advise against trading in the EURUSD until clear signals confirm the trend
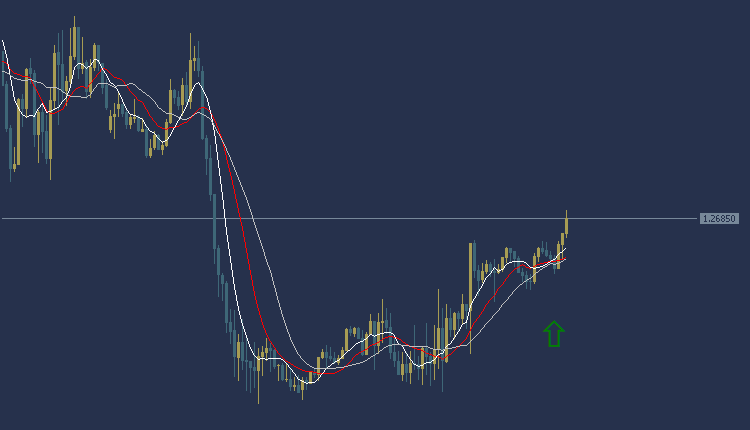
GBPUSD Technical Analysis: It is trading in an upward trend
The pound dollar is trading in an upward trend today during the European session. The pound is trading at $1.2684, and as the chart shows, the pound is trading above the intersections of the moving averages. The MACD indicator also indicates a positive trend indicating the presence of buying power.
Accordingly, we can make a purchase while waiting for the price of the pound-dollar pair to rise to the $1.2700 area, and the target could be the $1.2730 area. It is also recommended to choose the $1.2667 area as a stop loss point to control risk.
GBPUSD Technical Analysis: On the other hand
On the other hand, if the stop loss area at $1.2667 is broken, the pound price may head towards the $1.2638 level.
GBPUSD Technical Analysis: resistance and support levels
Second resistance: 1.2660
First resistance: 1.2670
Pivot level: 1.2675
First support: 1.2685
Second support: 1.2690
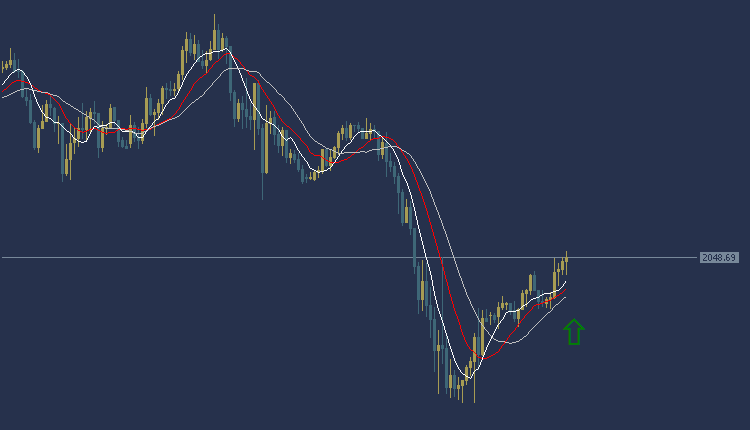
Gold Technical Analysis XAUUSD: today’s gold price
gold price Today’s against the dollar during the European session is taking an upward trend. Gold is trading at $2047 per ounce, and trading appears above most of the moving average intersections, as shown in the chart. The MACD indicator also indicates a positive trend indicating a weakness in selling power.
Accordingly, we can buy while waiting for the price of the yellow metal, gold, to rise to the area of $2043 per ounce, and the target could be the $2037 area per ounce. It is also recommended to choose the $2050 per ounce area as a stop loss point to control risk.
Gold Technical Analysis XAUUSD: On the other hand
On the other hand, if the stop loss area at $2050 per ounce is broken, the gold price may head towards the $2057 per ounce level.
Gold Technical Analysis XAUUSD: resistance and support levels
• Second resistance: 2049.02
• First resistance: 2051.79
• Pivot level: 2053.77
• First support: 2056.54
• Second support: 2058.52