Oil
Oil rose in the past week, as trading started from the region of 69 dollars per barrel on Monday 33/27/2023, to reach its highest peak on Friday 31/3/2023 at the region of 75 dollars per barrel, and trading was closed at this region, and among the factors that helped the price rise Oil The US Federal Reserve issued an increase of only 0.25% in the interest rate, with reference to the possibility of a temporary halt to future increases, which led to the decline of the dollar to its lowest level in six weeks, and oil became less expensive in other currencies.
Russia extended the decision to reduce its crude oil production by 500 thousand barrels / day until the end of June 2023, which raised concerns about the scarcity of supplies.
Total US exports of crude oil and petroleum products rose to a weekly record of 11.9 million BJ, supporting expectations of strong growth in demand.
Last week, oil started an upward trend from the region of $69 a barrel, up to its current price. The Fed signaled that it may raise interest rates sooner than expected and the rate hike has already been raised by 25 basis points. As a result, the dollar fell to its lowest level in six weeks, and oil became less expensive in other currencies.
Most Important News
On Wednesday 4/5/2023, the US Crude Oil Inventories Index was released
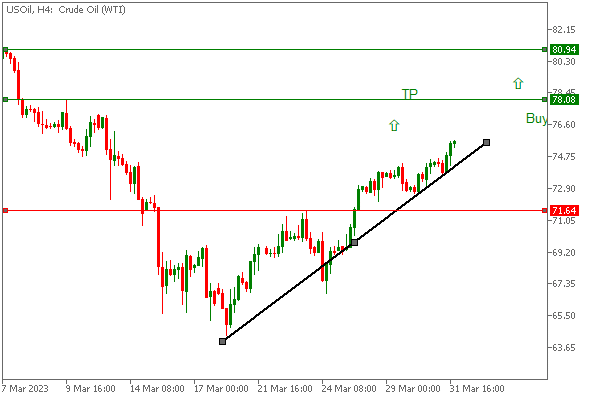
Technical analysis of the oil overview
- Technical analysis of the oil market indicates an upward trend.
- The previous highs were breached and the bullish trend line was not broken.
Indicator analysis
- Technical indicators indicate strength in the bullish direction.
In addition, the pair showed strength in the upside direction after closing the week without breaking the ascending trend line. Based on this data, we suggest the following steps for traders:
Support and resistance analysis
- There is strong support at $71 per barrel.
- There is resistance at $78 per barrel.
Trading recommendation
- It is advised to buy from the current closing area of $75 per barrel.
- It is advised to set a target for the upward movement at $78 per barrel.
- In the event that the market reaches the specified target, buying can be strengthened to reach the level of $80 per barrel.
- Putting a stop loss at the level of 71 dollars per barrel.
Technical analysis advice
Please keep in mind that technical analysis is dependent on current market conditions, and these conditions may change over time. Therefore, traders should consult a financial advisor before making buy or sell decisions. Market movement should be monitored regularly and plans changed according to new developments.
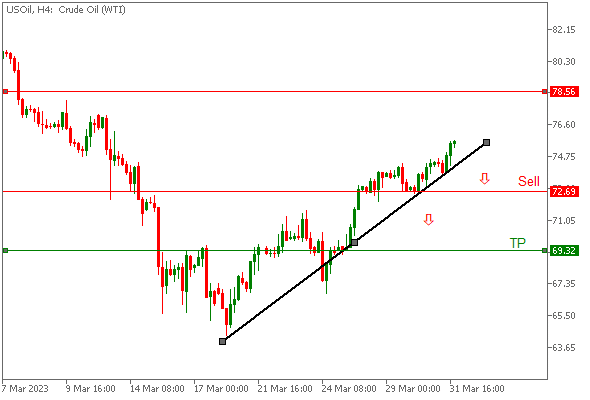
Technical analysis of oil if it returns to the bearish trend
If the trend is reversed, the oil market will trend downward. The critical area at $72 per barrel was broken, and this indicates the start of the bearish trend, targeting $69 per barrel.
Dow Jones US30
The Dow Jones index rose last week, as it started trading from the region 32281 on Monday 33/27/2023 to reach its highest peak on Friday 31/3/2023 at the region 33279, and trading was closed at this region, and the Dow Jones index reacted inversely, especially after the data came The American economy is contrary to expectations, including the gross domestic product of the United States, which came less than expectations, and the initial unemployment data was negative, which reinforced the weakness of the dollar, and after the Federal Reserve raised interest rates, this rise in interest negatively affected the US dollar.
Last week, the Dow Jones started an upward trend from the area of 32281, up to its current price. The hike was contrary to the Federal Reserve signaling that it may raise interest rates sooner than expected and the rate was already raised by 25 basis points. However, contrary to expectations, the US dollar did not issue a bullish reaction, on the contrary, the US dollar declined, affected by the results of the US GDP, as these results were contrary to expectations, which reinforced the weakness of the US dollar.
The most important economic news
- On Monday 3/4/2023, the US ISM Manufacturing Purchasing Managers’ Index (PMI).
- On Tuesday 4/4/2023, the employment opportunity index in the United States.
- On Friday, April 7, 2023, the ADP Non-Farm Payroll Change report will be released, which measures the change in the number of jobs in the private sector in the United States, and this report is considered very important
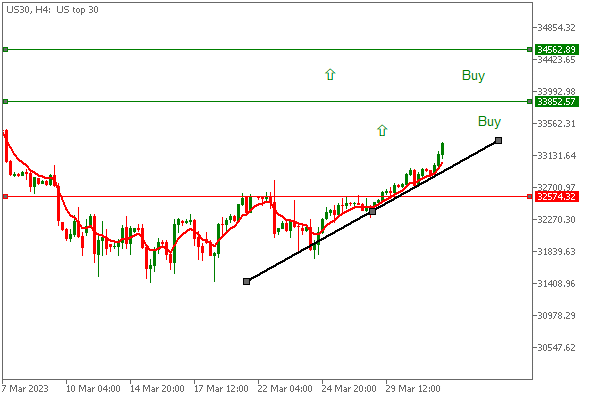
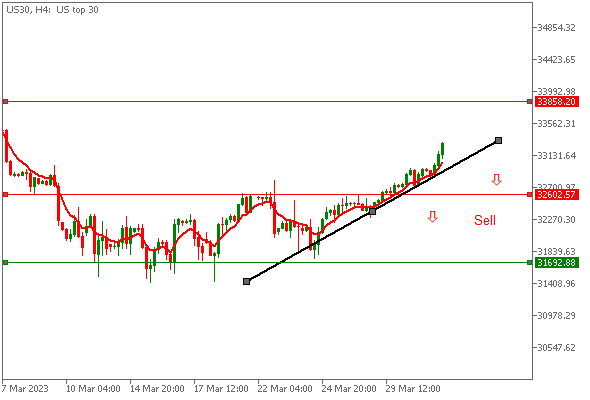
Technical analysis report for the Dow Jones US30
Based on the attached chart, we conclude that the Dow Jones US30 is following an upward trend. This trend is reinforced by several factors, including breaking the previous highs and not breaking the bullish trend line. In addition, the uptrend line has not been broken, which indicates the strength of the uptrend.
Support and resistance analysis
The main support level is at 32281, which is a strong level to buy. And upon breaking the 33852 area, the rise could continue to the 34562 area. On the other hand, the resistance level at 33852 could be formed if this level is not broken.
Trading recommendation
Based on the above technical analysis, the following steps can be recommended to traders:
- Buying from the current closing area at 32281.
- Targeting the 33852 area as a target for the upward movement.
- If the target is broken, the rise can continue to the 34562 area.
- Stop loss at 32574.
Technical analysis advice
Please keep in mind that technical analysis is dependent on current market conditions, and these conditions may change over time. Therefore, traders should consult a financial advisor before making buy or sell decisions. Market movement should be monitored regularly and plans changed according to new developments.
Technical analysis of the Dow Jones US30 if it returns to the bearish trend
If the downward trend of the Dow Jones continues, it will look for a sell entry from the support area at 32,602 points. From here, the Dow Jones can be sold to target the opposite target at 31,692 points, and place a stop-loss order at 33,858 points.
EUR/USD
The EUR/USD had a mixed week as it started an upward trend. The pair reached a high at 1.0925 on Thursday, March 30th, propelled by positive economic data from the Eurozone, including the German Consumer Price Index (CPI) on a monthly basis, which came out higher than expected, and this led to an increase in demand for the Euro in Trading, which led to a rise in the price of the euro. The sentiment was also supported by the ECB’s commitment to maintaining its accommodative monetary policy stance. However, the pair subsequently fell amid growing concerns about rising interest rates in the US.
The Eurodollar currency pair started the week at 1.0766, up to its current price. The rise in the exchange rate was due to the Fed signaling that it may raise interest rates sooner than expected and the rate was actually raised by 25 basis points. However, contrary to expectations, the US dollar did not issue a bullish reaction, on the contrary, the US dollar declined, affected by the results of the US GDP, as these results were contrary to expectations, which reinforced the weakness of the US dollar.
From a technical perspective, the EUR/USD appears to be consolidating in a range of 1.0514 and 1.0928 since early March, with no clear sign of a breakout in either direction. The pair is currently trading above the 50-day and 100-day moving averages, indicating an upward trend.
In conclusion, the performance of the euro-dollar currency pair was mixed during the past week, with positive economic data from the Eurozone supporting the pair earlier in the week, but concerns about rising interest rates in the United States affected the exchange rate later in the week. . From a technical perspective, the pair appears to be consolidating within a range, with no clear sign of a breakout in either direction. As always, investors should remain vigilant and closely monitor the latest developments in the global financial markets to make informed trading decisions.
The most important economic news
A number of important economic news was published in the past week that affected the trading of the EUR in the forex market. The most important of this news:
- The German Consumer Price Index (CPI) was released on a monthly basis and was higher than expected, and this led to an increase in the demand for the euro in trading, which led to a rise in the price of the euro.
- The trading of the US dollar was also affected by the results of the gross domestic product of the United States, as these results were contrary to expectations, which reinforced the weakness of the US dollar.
In addition, the index of initial jobless claims affected the trading of the euro, as the data showed an increase in jobless claims, which affected the trading of the euro positively.
A schedule of important economic news that will be released in the coming week and that will affect currency trading in the forex market. We review this news:
- On Monday, April 3, 2023, the Swiss Consumer Price Index (CPI) will be released on a monthly basis. This indicator is used to measure price changes of goods and services in Switzerland, and can affect the trading of the Swiss franc and the euro
- On Tuesday, April 4, 2023, employment data will be released in the United States. This data is a leading indicator of the state of the US economy and can affect the trading of the US dollar in the forex market.
- On Wednesday, April 5, 2023, the US ISM Non-Manufacturing Purchasing Managers’ Index (PMI) and Initial Jobless Claims will be released in the US. This indicator is used to assess service sector activity in the US and can influence the trading of the US dollar, while Initial Jobless Claims is an indicator of the economic situation in the US.
- On Friday, April 7, 2023, the ADP non-agricultural job change report will be released, which measures the change in the number of jobs in the private sector in the United States. This report is very important and may affect the trading of all currencies in the market, including gold.
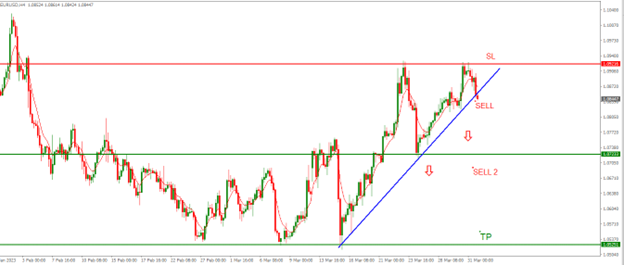
Technical analysis of the euro dollar
We conclude from the technical analysis of the EUR/USD currency pair, based on the attached chart, that there is a possibility of the euro falling against the US dollar. We came to this conclusion based on several factors:
- The pair failed to breach the previous top.
- Breaking the bullish trend line.
- Formation of a double tops pattern, although it has not been completed yet, waiting for the neckline to be broken at the price level of 1.0723.
In addition, the pair showed weakness in the upside direction after closing the week by breaking the ascending trend line. Based on this data, we suggest the following steps for traders:
- Sell from the current closing price at 1.0844.
- Strengthening short positions from the 1.0723 area.
- Targeting 1.0525 as a target for the expected bearish movement.
- Stop loss at 1.0921
Please keep in mind that technical analysis is dependent on current market conditions, and these conditions may change over time. It is always a good idea to consult a financial advisor before making a decision to buy or sell.
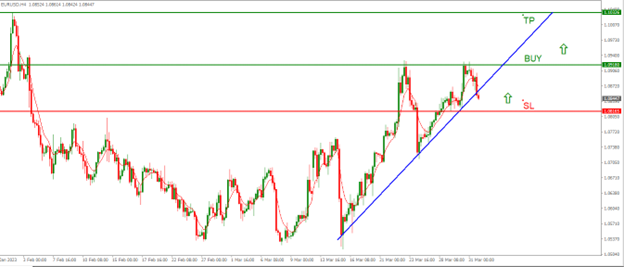
If the euro returns to the previous bullish trend against the dollar and breaks the top of 1.0918, then the euro can be bought from above this top with the target of 1.1032 and a stop loss at 1.0816.
Therefore, the buying decision will be taken after the euro breaches 1.0918. A stop loss will be placed at 1.0816 to exit the deal in case the trend reverses. The deal will be closed at the target of 1.1032.
If the euro continues to fall away from 1.0918, this scenario will not materialize and it would be preferable to re-analyze.
Based on this, the technical analysis of the Eurodollar is: buying the Euro from above 1.0918 with a target of 1.1032 and placing a stop loss at 1.0816.
Pound Sterling
The British pound against the dollar witnessed a week of mixed results, but it took a general bullish trend, as there were central bank data that pushed the market movements relatively. The pair opened last week at approximately 1.2236 and closed at 1.2335.
There were relatively few economic data releases during the week that had a significant impact on the GBPUSD. The results of the gross domestic product of the United States and the index of initial jobless claims, which came in violation of expectations, had a significant impact on the trading of the US dollar, which also affected the trading of the British pound against the dollar.
There were no major data from the Bank of England or the US Federal Reserve during the week that had an impact on the GBPUSD. However, relative gains for the pair appeared, which showed that financial houses believe that the Bank of England will reverse the US Federal Reserve’s policy and issue a tough rhetoric regarding inflation. In fact, the Bank of England actually warned companies to stop raising rates last week.
The pound sterling against the dollar had a mixed week of results in terms of technical moves, with the pair trading in a range between 1.2422 and 1.2218. There were some minor fluctuations within this range, reaching a high of 1.2422 on Friday, March 31st. The last two weeks of trading have seen the effects of nervous behavioral emotions causing volatility in the forex market and this week may be reactionary as well.
In conclusion, the British pound against the dollar took an upward trend last week, with some important economic data that pushed the market movements relatively. While there were some concerns about geopolitical tensions, they had little impact on the GBPUSD pair. Looking ahead, focus is likely to shift to upcoming economic and central bank data, which may provide more direction for the pair in the coming weeks.
Important economic news
A number of important economic news releases were published in the past week which affected the trading of the pound sterling in the forex market, including the US GDP results and the initial jobless claims index which came out different from expectations and affected the trading of the US dollar.
The economic markets are waiting for the highly anticipated data in the coming week as the release of US job openings data, the US ISM Non-Manufacturing Purchasing Managers’ Index (PMI) and the US Initial Jobless Claims, which could affect the trading of the US dollar in the forex market. The ADP Non-Farm Payrolls Change will also be released on Friday, April 7, 2023, which is very important and may affect the trading of all currencies in the market including gold.
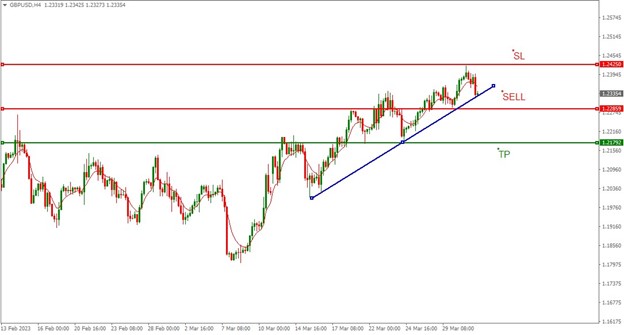
Technical analysis of the sterling dollar
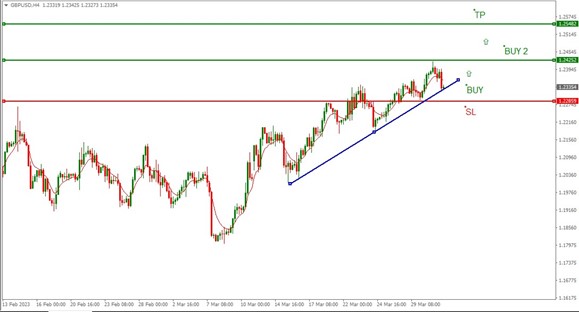
We conclude from the technical analysis of the GBP/USD pair, based on the attached chart, that there is a potential for the British pound to rise against the US dollar. We came to this conclusion based on several factors:
- The pair failed to break the bullish trend line.
- The pair did not breach its last previous level, which supports the possibility of the pair continuing to rise.
Based on this data, we suggest the following steps for traders:
- Buy from the current closing price at 1.2335.
- Strengthening buying positions from the 1.2425 area.
- Targeting the 1.2548 area as a target for the expected upward movement.
- Stop loss at 1.2285.
Please keep in mind that technical analysis is dependent on current market conditions, and these conditions may change over time. It is always a good idea to consult a financial advisor before making a decision to buy or sell.
Based on our technical analysis of the GBP/USD pair, we have identified a possible scenario where the pound may face a bearish trend and breach the bottom level at 1.2285. In this case, we suggest selling the pound from below this level with a target of 1.2179 and a stop loss at 1.2425.
It is important to note that this selling decision should only be made after the pound breaches the level of 1.2285. If the pound continues to rise away from this area, this scenario may not materialize, and it would be advisable to re-analyze the situation.
Accordingly, the technical analysis for the Sterling Dollar is: Sell the Sterling from below the 1.2285 area, with a target of 1.2179, and place the stop loss at 1.2425.
Gold
Last week, gold trading witnessed noticeable ups and downs, and it reached its highest point in last week’s trading at 1988 dollars an ounce on Friday 3/31/2023. Despite this, gold is considered to be in decline, after it failed to break the biggest peak during the past month, as it reached a day Monday 3/20/2023 to 2010 dollars an ounce, this shift in gold prices comes as a result of economic data and recent events, as the US GDP data greatly affected gold trading, as the results were less than expected and increased the weakness of the US dollar. The increase in jobless claims in the initial jobless claims index also affected gold’s trading positively.
Gold started the week at $1945 an ounce, up to its current price. The rise in the exchange rate was due to the Fed signaling that it may raise interest rates sooner than expected and the rate was actually raised by 25 basis points. However, contrary to expectations, the US dollar did not issue a bullish reaction, on the contrary, the US dollar declined, affected by the results of the US GDP, as these results were contrary to expectations, which reinforced the weakness of the US dollar.
Next week’s news
The economic markets are awaiting the highly anticipated decision on the Australian interest rate, which will be announced on Tuesday, February 4, 2023. It is known that the Australian economy is considered one of the largest global sources of gold, as up to a third of the total global gold is produced in Australia. Movements in the Australian economy usually affect the price of gold in the global market. It is expected that the decision of the Australian interest rate will affect the trading of gold in the global markets, as it may lead to changes in the value of the Australian dollar against other currencies, which will affect the price of gold in the market.
On Friday, April 7, 2023, the ADP non-agricultural job change report will be released, which measures the change in the number of jobs in the private sector in the United States. This report is very important and may affect gold trading.
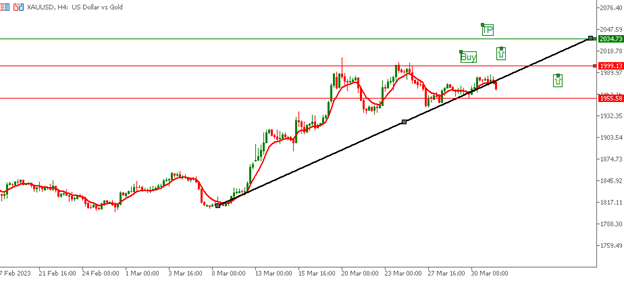
Technical analysis of gold
We conclude from the technical analysis of gold, based on the attached chart, that there is a possibility of gold falling. We came to this conclusion based on several factors:
Gold technical analysis
From the overview, gold appears to be moving in a narrow range between $1988 and $2010 an ounce. Gold is still in a decline mode after failing to breach its highest level during the past month and breaking the bullish trend line.
Indicators analysis
- The 50-period SMA is showing a contraction to the upside.
- The RSI is turning negative as it is trading within an overbought level.
In addition, the pair showed weakness in the upside direction after closing the week by breaking the ascending trend line.
Support and resistance analysis
- The current important level of support is at $1955 an ounce.
- The main resistance level is at $2010 an ounce.
Gold technical analysis advice
As gold failed to breach the previous top and break the bullish trend line, there is a possibility for gold to fall.
- Traders are advised to wait for prices to fall to the current support area at $1955 an ounce before entering into a sell-off.
- Traders target $1906 an ounce as a target for the expected downward movement.
- Traders are advised to place a stop loss at $1999 an ounce.
It should be borne in mind that technical analysis is based on current market conditions, and traders should consult a financial advisor before making buy or sell decisions.
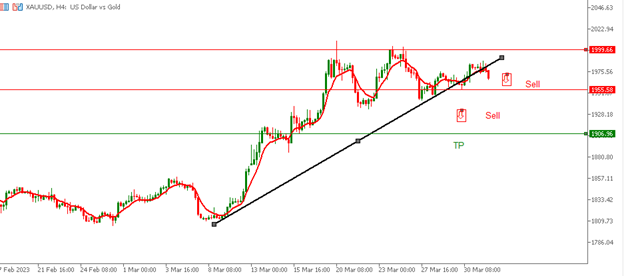
If gold returns to the previous bullish trend and breaks the top of $1999 an ounce, gold can be bought from above this top with a target of $2034 an ounce and a stop loss at $1955 an ounce.