EURUSD weekly report
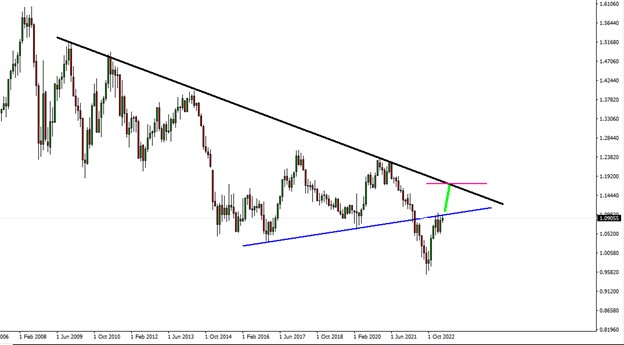
The euro against the dollar closed last week’s session at the level of 1.0905, which is the highest closing since April 20, 2022, and it should be noted here that the euro-dollar is facing very great resistance on the long-term and medium-term timeframes around the 1.10000 area, in addition to being the 50% correction of the decline that occurred. It went from 1.2350 to near 95.00
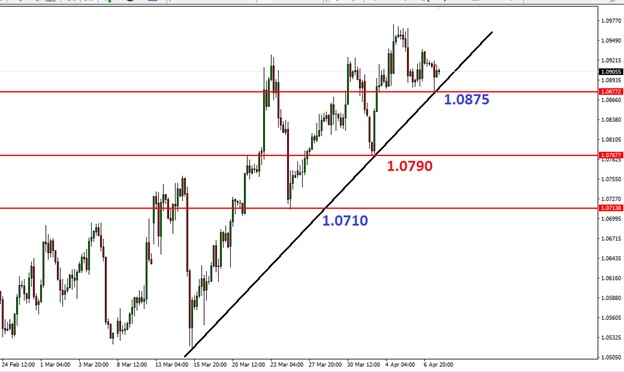
The week started with a violent decline, following a rebound that extended to record a new peak at 1.0972, and it was unable to maintain its strength in the ascent, and currently it is considered the logic of resistance that must be respected, which is 1.0935 then 1.0975, Because breaking through the 1.0975 area and holding above 1.10000 leads to an ascension.
It seems that the Euro is very strong and may target the 1.1600 area, but in the event that it starts to fall again, the scenario will be different and may be easier because the support areas are very clear and the most important support areas have been clarified in the case of a downward move.
Technical Indicators Analysis
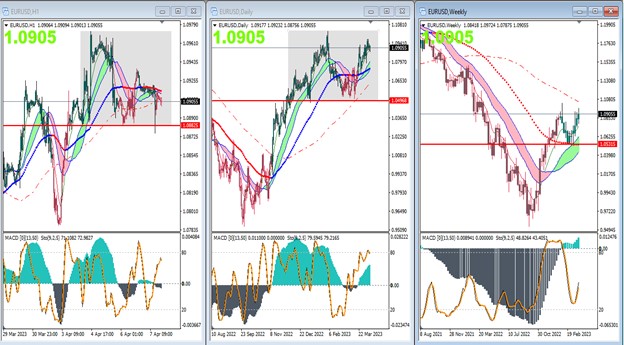
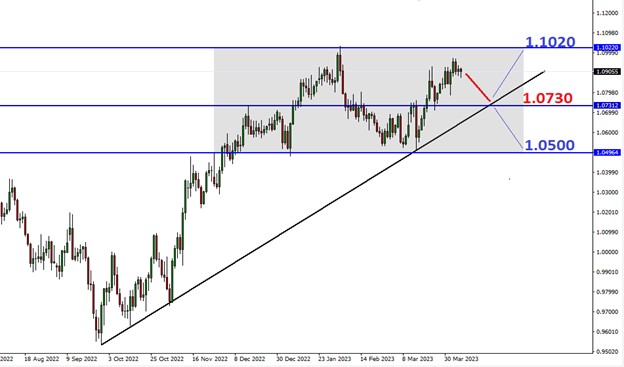
The weekly trend is bullish, provided that 1.0500 is not broken, to target 1.1600. The daily time frame has been moving sideways for a while between 1.0500 and 1.1000 the hourly short-term trend is moving sideways between 1.0890 and 1.0970 by viewing the charts; we will find that the 1.0890 area is important on the short time frame, because maintaining it may be a motive for breaching 1.1600. As for the important support area on the larger frame, it is 1.0730/1.0790, because breaking it could lead to the 1.0500 area.
GBPUSD Weekly Report
The pound closed against the dollar in the last session of last week at the level of 1.2426, which is a very important area, as the pair tried to breach it and hold above it several times, and it is one of the highest closings in the last 12 months, because its penetration targets an ascension to an area near the bearish trend line for the pair in the medium term. As for the most important support area, it is 1.1900, which the pair also tried to break, but it did not succeed so far

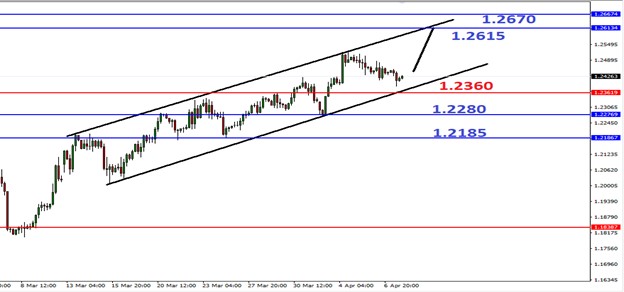
And since the beginning of the week, the pair started to fall after a rebound that extended from the 1.2280 area to record a new peak at the 1. Region, near 1.2500, and it was unable to maintain its strength in the ascent, and it took a gradual decline since the middle of the week, achieving a correction of about 50% of the rise it achieved at the beginning. Through the chart below, we will find that the 1.2360 area is an important support point, breaking which it may lead to another experience at the bottom of last week. In the case of a rise, stability above 1.2360, the target will be to rise to the areas of 1.2610 and 1.2670.
Technical Indicators Analysis
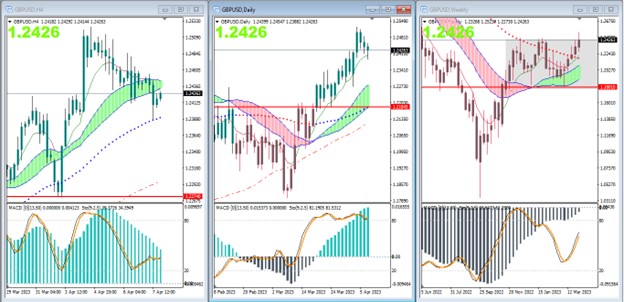
The weekly trend is in a sideways direction, tending to the upside, provided that 1.2280 is not broken, to target 1.2670. The daily trend is in the same direction as the sideways trend that appears on the weekly time frame the short-term trend over the four hours is moving in an ascending channel, in which it is forbidden to break 1.2360, to target 1.2600.
USOIL weekly report
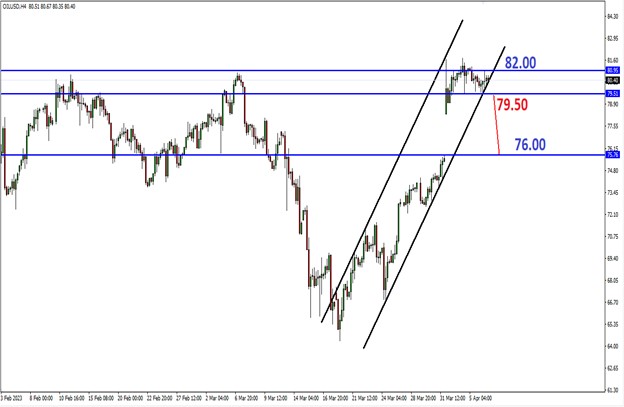
Oil closed in the last session of last week at the level of 80.40, which is a very important area, as the price approached its strongest resistance since November 2022, because its breach turns the direction of oil into a strong bullish direction, but during the ascent, the price moved with a price gap that appears on the chart, as the price rose from the area 64.30 until it closed at 75.80, and it represented a line representing very strong resistances, and the next day, the price opened above the downtrend line for petroleum, and the signal would have been stronger if the opening had been above 83.00. Therefore, there can be two possibilities for the price to move
- Continuing the rise and breaching 00, and the target will be 91.00
- Starting to drop to cover the price gap at 00
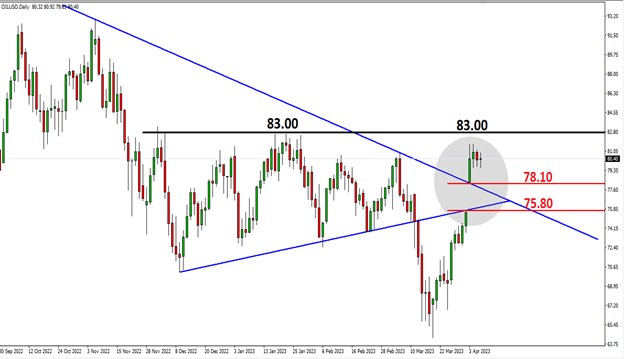
On the four-hour time frame, the price is rising in an ascending channel It shows the 79.50 area, which if broken, means the beginning of a decline to cover the price gap, but the breach of 82.00 paves the way for the rise and the breach of the 83.00 area.
Technical Indicators Analysis
-
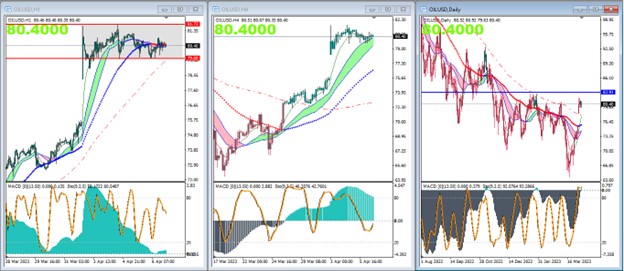
USOIL Daily Frame
- On the daily time frame, it appears that the trend has turned from bearish, to sideways, and by breaching 83.00, it will turn bullish.The four hours is in an upward trend, and it is forbidden to break the 75.50 area, which is currently considered a stop loss
-
USOIL Hourly Frame
- The hourly time frame has turned into a sideways trend, showing the importance of not breaking 79.50, as the sideways move is between 79.50 and 82.00.
Dow Jones weekly report
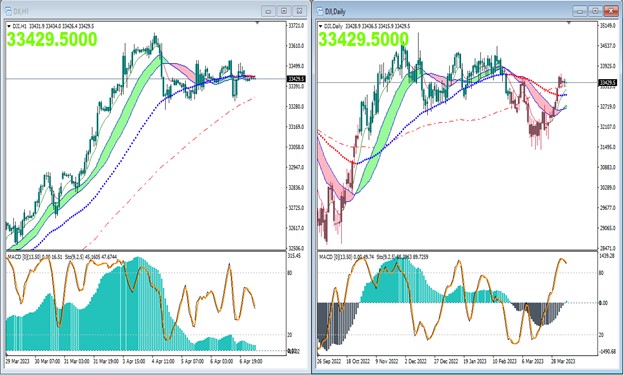
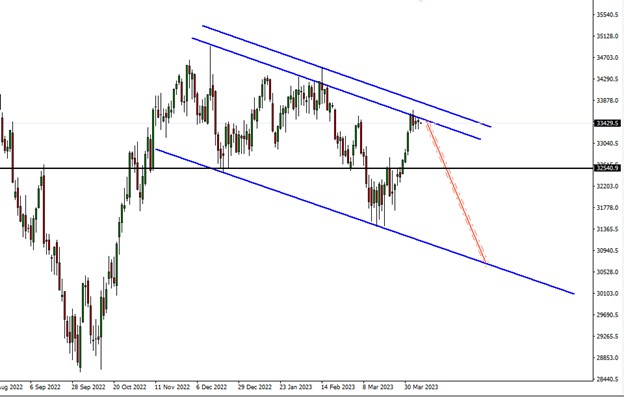
The Dow Jones closed in the last session of last week at the level of 33430, and it is clear that the Dow moved in a descending price channel, as the price reached its upper line, which pushes trading in a big way to decline again, and the 32600 area will be the area that will separate the possibility of a drop to the lower boundary of the channel at An area near 31000, and to breach the channel upwards, it is necessary to break the 34000 area
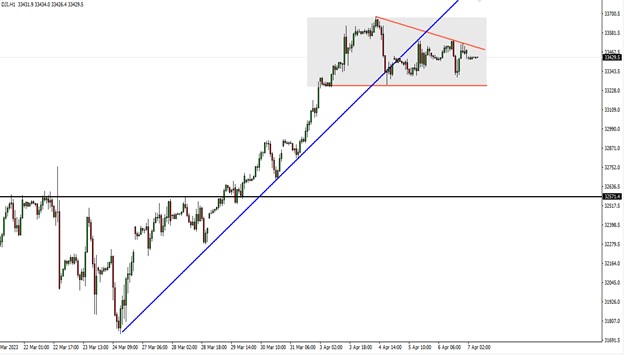
And it appears on the hourly time frame that the price moved in an occasional direction between 33200 and 33700, so breaking the 33200 area will lead to the beginning of the decline, targeting 32600. As for breaching 33700, it will be the real test for trying to break 34000, which if broken, the target will be 34500.
Technical Indicators Analysis
The daily timeframe is still in a bearish direction, but it has some weakness. As for the hourly time frame, we notice a clear sideways movement.