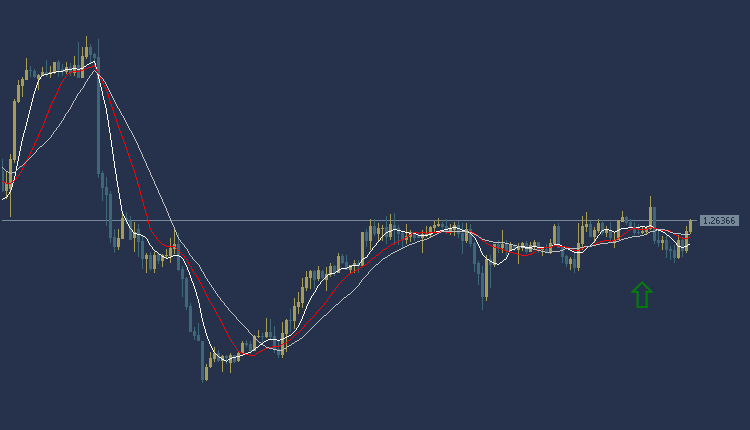
GBPUSD Technical Analysis today is in a weak upward trend during the Asian session. The pound is trading at $1.2635, and trading appears above most of the moving average intersections. As the MACD indicator indicates a positive trend, based on this, we can look to buy from the rise to the price of $1.2653, and the targeted target could be the $1.2677 area. It is also recommended to choose the $1.2587 area as a stop loss point to control risks.
GBPUSD Technical Analysis: on the other side
On the other hand, if the stop loss area at $1.2587 is broken, the pound price may head towards the $1.2569 level.
GBPUSD Technical Analysis: resistance and support levels
• Second resistance: 1.2678
• First resistance: 1.2646
• Pivot level: 1.2639
• First support: 1.2630
• Second support: 1.2623
NZDUSD Technical Analysis: an upward trend
NZDUSD Technical Analysis: The NZDUSD is trading in an upward trend today during the Asian session. The NZDUSD price is trading at 0.6135, and trading appears above most of the moving average intersections. The MACD indicator also indicates positive signals
Accordingly, we can look to buy from the rise to the price of 0.6143, and the targeted target could be the 0.6157 area. It is also recommended to choose the 0.6113 area as a stop loss point to control risk.
NZDUSD Technical Analysis: On the other hand
On the other hand, if the stop loss area at 0.6113 is broken, the New Zealand price may head towards the 0.6102 level.

NZDUSD Technical Analysis Resistance and Support:
• Second resistance: 0.6147
• First resistance: 0.6142
• Pivot level: 0.6138
• First support: 0.6130
• Second support: 0.6124
Gold Technical Analysis: Gold prices falling
Gold Technical Analysis: The price of gold is trading today at $2017 per ounce. Trading appears in a downward trend, as the price of gold is trading below the intersections of the Moving Average indicators. As for the MACD indicator, it indicates a negative trend.
Accordingly, we can look to sell from the decline to the price of $2012 per ounce, and target the $2005 per ounce area to take profits while setting the $2025 per ounce area as a stop loss.
Gold Technical Analysis: On the other hand
On the other hand, if the stop loss area of $2025 per ounce is broken, the price may head to the $2030 per ounce area.

Gold Technical Analysis: resistance and support levels
• Second resistance: 2019.22
• First resistance: 2018.40
• Pivot level: 2017.20
• First support: 2016.75
• Second support: 2016.00
USOIL Technical Analysis: is an upward trend
USOIL Technical Analysis, in the global oil market, the price is trading at the area of $76.63 per barrel. According to technical analysis, the current trend indicates an upward trend with prices trading above the intersections of the moving average, and the MACD indicator also shows positive signs.
Accordingly, we can buy from the rise to the price of 77.13, and we will target $77.73 per barrel as a profit-taking target. To ensure risk control, it is recommended to set a stop loss point at $75.43 per barrel.
USOIL Technical Analysis: On the other side
If the stop loss area at 75.43 per barrel is broken, targeting the additional support level at $74.89 per barrel could be achieved.

USOIL Technical Analysis: resistance and support levels
• Second resistance: 76.99
• First resistance: 76.88
• Pivot level: 76.70
• First support: 76.49
• Second support: 76.22