
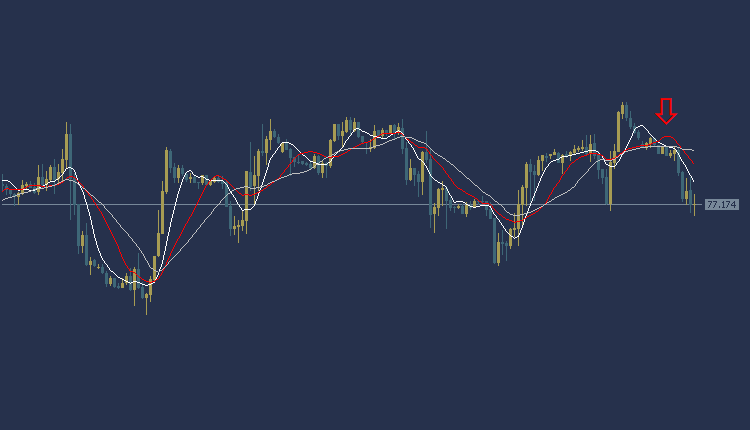
USOIL Technical Analysis, in the global oil market, the price is trading at the area of $77.17 per barrel. According to technical analysis, the current trend indicates a downward trend with prices trading below the moving average intersections, and the MACD indicator also shows a negative trend.
Accordingly, selling can fall to the price of 76.90, and we will target $76.57 per barrel as a profit-taking target. To ensure risk control, it is recommended to set a stop loss point at the $77.69 per barrel area.
USOIL Technical Analysis: On the other side
If the stop loss area at 77.69 per barrel is broken, targeting the additional support level at $77.98 per barrel could be achieved.
USOIL Technical Analysis: resistance and support levels
• Second resistance: 77.79
• First resistance: 77.46
• Pivot level: 77.29
• First support: 76.83
• Second support: 76.49
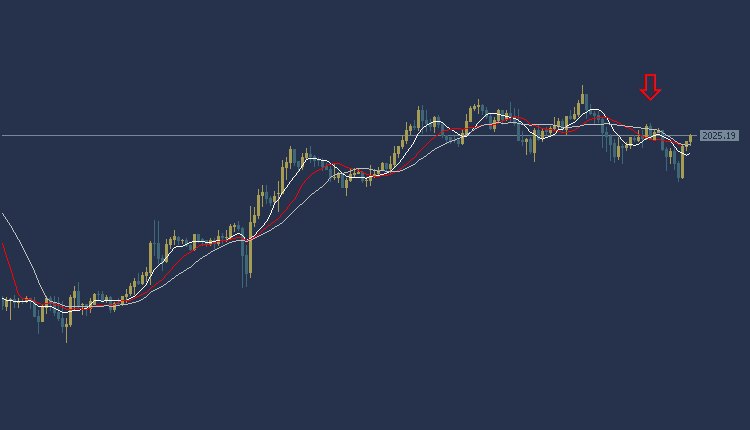
Gold Technical Analysis: sideways trend
Gold Technical Analysis: The price of gold is trading today at $2025 per ounce. Trading appears in a downward trend with the appearance of a sideways trend on the chart, as the price of gold is trading below the intersections of the Moving Average indicators. As for the MACD indicator, it indicates negative signals.
Accordingly, we can look to sell from a decline to the price of $2022 per ounce, and target the $2016 per ounce area to take profits while setting the $2021 per ounce area as a stop loss.
Gold Technical Analysis: On the other hand
On the other hand, if the stop loss area of $2033 per ounce is broken, the price may head to the $2039 per ounce area.
Gold Technical Analysis: resistance and support levels
• Second resistance: 2027.15
• First resistance: 2026.70
• Pivot level: 2025.55
• First support: 2024.64
• Second support: 2023.77
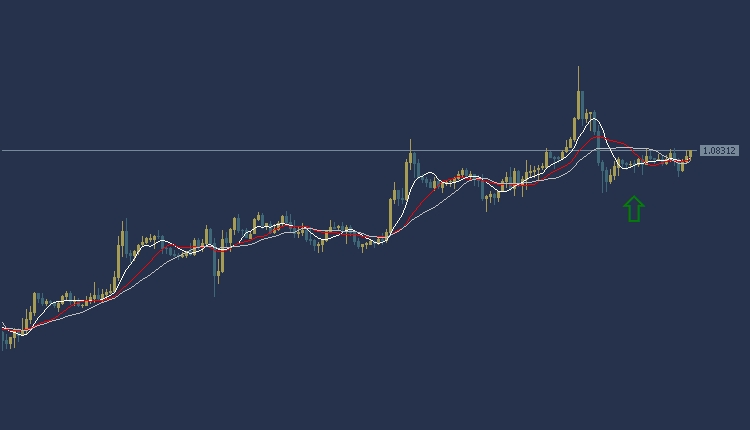
EURUSD Technical Analysis: an upward trend
EURUSD Technical Analysis: The EURUSD is in an upward trend today during the American session. The EURUSD is trading at $1.0831, where prices appear to be trading above most of the moving average intersections shown on the chart. The MACD indicator also indicates a positive trend and, accordingly, we can look to buy from the rise to the price of $1.0845, and the target could be the $1.0864 area. It is also recommended to choose the $1.0806 area as a stop loss point to control risk.
EURUSD Technical Analysis: On the other hand
On the other hand, if the stop loss area at $1.0806 is broken, the EURUSD price may head towards the $1.0791 level.
EURUSD Technical Analysis: resistance and support levels
• Second resistance: 1.0847
• First resistance: 1.0841
• Pivot level: 1.0837
• First support: 1.0824
• Second support: 1.0814
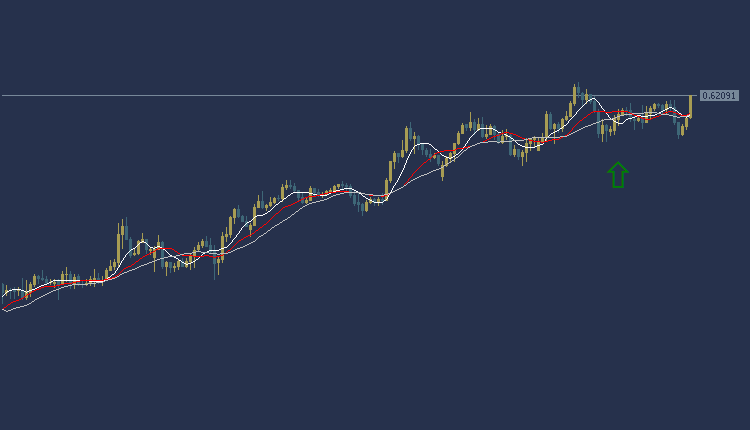
NZDUSD Technical Analysis: bullish trading
NZDUSD Technical Analysis: The NZDUSD is trading in an upward trend today during the American session. The NZDUSD price is trading at 0.6209, and trading appears above most of the moving average intersections. The MACD indicator also indicates positive signals
Accordingly, we can look to buy from the rise to the price of 0.6221, and the targeted target could be the 0.6243 area. It is also recommended to choose the 0.6169 area as a stop loss point to control risk.
NZDUSD Technical Analysis: On the other hand
On the other hand, if the stop loss area at 0.6169 is broken, the NZDUSD price may head towards the 0.6148 level.
NZDUSD Technical Analysis: Resistance and Support:
• Second resistance: 0.6229
• First resistance: 0.6219
• Pivot level: 0.6212
• First support: 0.6200
• Second support: 0.6192


